
IGIL — Symmetrical Triangle
International Gemmological Institute (India) Limited · Lower highs and higher lows squeezing into a point — a coiling market that has not chosen a side yet.
Symmetrical Triangle · Weekly candles
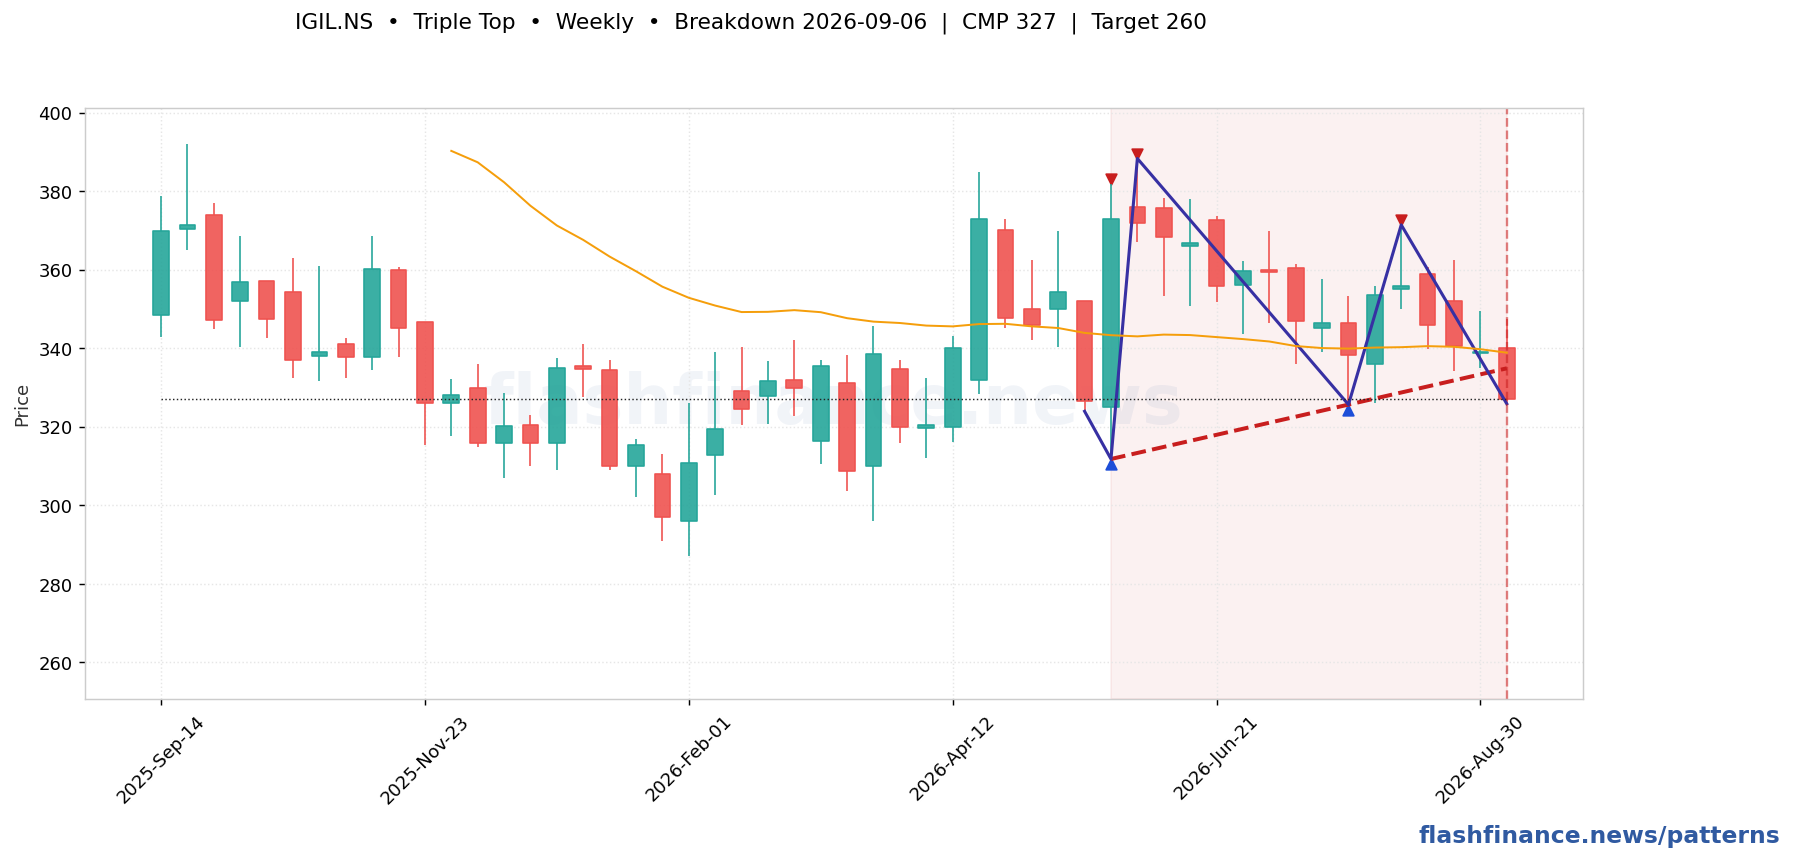
Trigger. A close outside either boundary. The direction of the break is the signal — the pattern itself does not predict it.
Target. Project the widest height of the triangle from the point where price leaves the boundary, in the break's direction.
Invalidation. Price closing back inside the triangle after breaking out — a common trap in low-volume breaks.
| Stock | TF | State | CMP | Trigger | Away | Target | Touches |
|---|---|---|---|---|---|---|---|
| HDBFSHDB Financial Services Limited | Daily | Neutral | ₹676 | ₹688 | 1.8% | ≈₹833 (+23%) | 4 |
| LTLarsen & Toubro Limited | Weekly | Neutral | ₹4,031 | ₹4,109 | 1.9% | ≈₹4,984 (+24%) | 4 |
| HINDALCOHindalco Industries Limited | Weekly | Neutral | ₹1,027 | ₹1,064 | 3.6% | ≈₹1,476 (+44%) | 4 |
| CGPOWERCG Power and Industrial Solutions Limited | Weekly | Neutral | ₹888 | ₹922 | 3.8% | ≈₹1,149 (+29%) | 6 |
| SOUTHBANKThe South Indian Bank Limited | Weekly | Neutral | ₹45.70 | ₹47.86 | 4.7% | ≈₹58.44 (+28%) | 7 |
| DBCORPD.B.Corp Limited | Weekly | Neutral | ₹199 | ₹208 | 4.9% | ≈₹273 (+37%) | 6 |
| IOCIndian Oil Corporation Limited | Weekly | Neutral | ₹136 | ₹143 | 4.9% | ≈₹170 (+25%) | 8 |
| CARBORUNIVCarborundum Universal Limited | Weekly | Neutral | ₹1,120 | ₹1,182 | 5.5% | ≈₹1,531 (+37%) | 6 |
| JKILJ.Kumar Infraprojects Limited | Weekly | Neutral | ₹490 | ₹519 | 5.8% | ≈₹623 (+27%) | 8 |
| SPLPETROSupreme Petrochem Limited | Weekly | Neutral | ₹716 | ₹763 | 6.5% | ≈₹917 (+28%) | 8 |
| RITESRITES Limited | Weekly | Neutral | ₹216 | ₹232 | 7.1% | ≈₹287 (+32%) | 7 |
| UBLUnited Breweries Limited | Weekly | Neutral | ₹1,315 | ₹1,411 | 7.3% | ≈₹1,896 (+44%) | 4 |
See every symmetrical triangle found today →
How these are found: swing highs and lows are picked out with a percentage ZigZag on daily and weekly candles, and the boundaries are line-fitted through those swings. A formation is only published when the fit is tight, the boundaries are actually touched several times, and the price action stays inside them. The most recent swing is provisional, so a forming pattern can still change shape on the next candle, and patterns whose break already played out are dropped rather than shown as fresh. Levels and targets are the textbook measured moves, not forecasts. This is auto-generated market data, not investment advice.
