
SBIN — Triple Bottom
State Bank of India · Three successful defences of the same low — a base with more proof behind it than a double bottom.
Triple Bottom · Daily candles
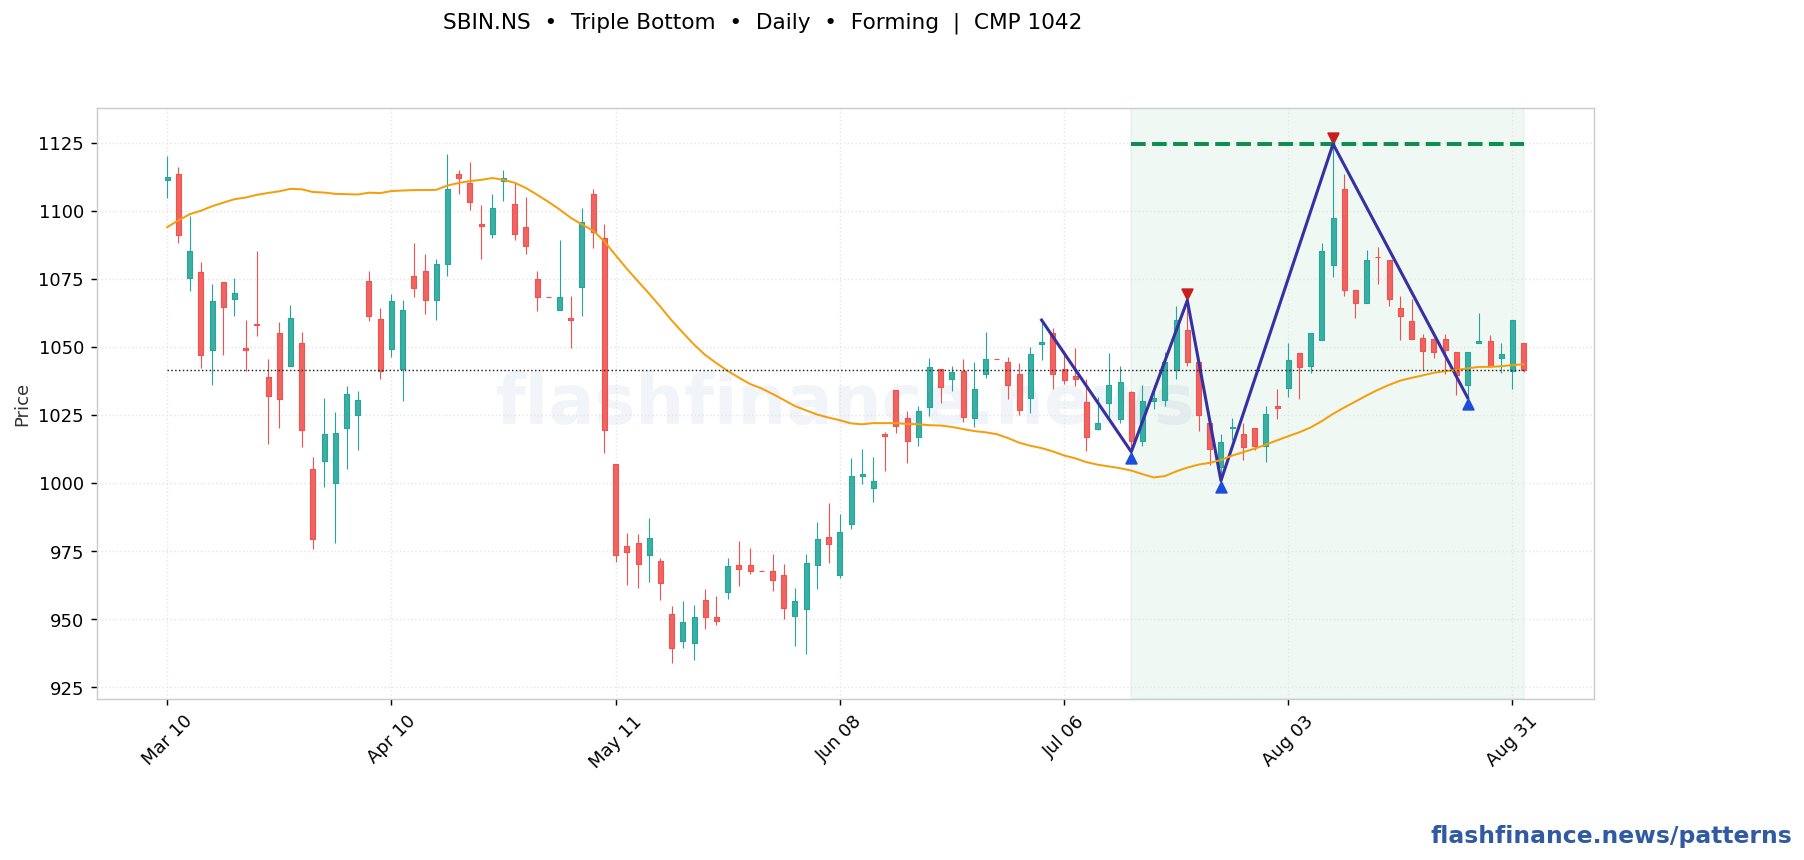
Trigger. A close above the neckline drawn through the intervening highs.
Target. Project the height from the lows to the neckline up from the break.
Invalidation. A close below the three lows. A floor that fails on the third test usually fails badly.
Double Bottom · Weekly candles
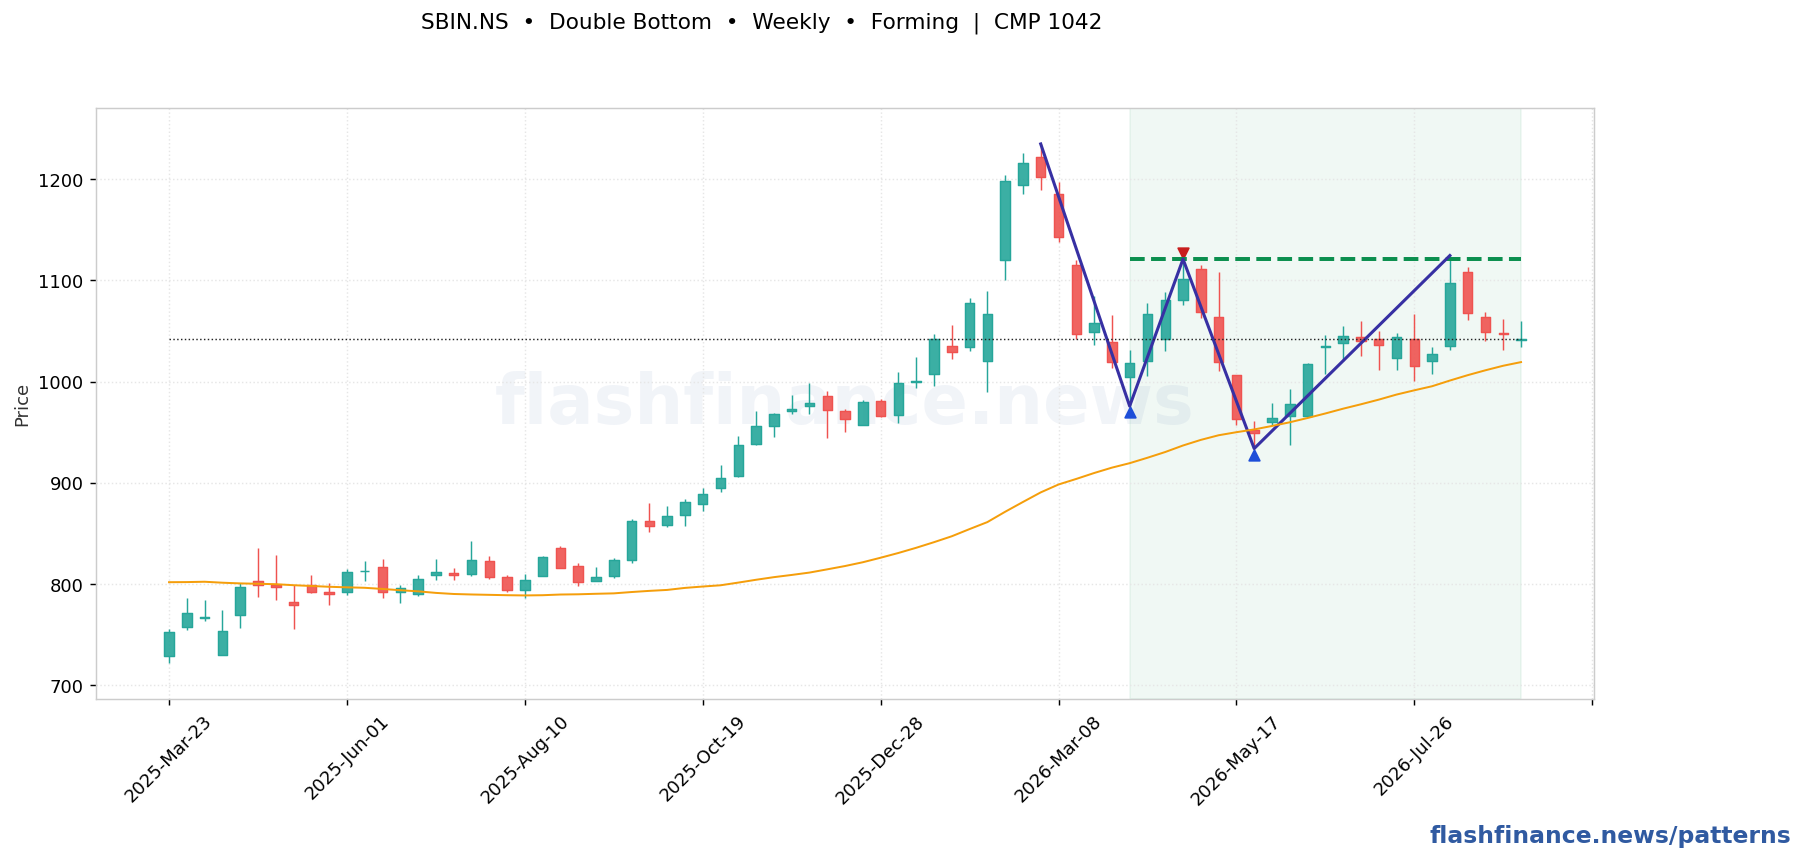
Trigger. A close above the neckline drawn through the intervening highs.
Target. Project the height from the lows to the neckline up from the break.
Invalidation. A close below the three lows. A floor that fails on the third test usually fails badly.
| Stock | TF | State | CMP | Trigger | Away | Target | Touches |
|---|---|---|---|---|---|---|---|
| KOTAKBANKKotak Mahindra Bank Limited | Daily | ▲ Broken out | ₹428 | ₹414 | broken | ₹465 (+9%) | 5 |
| ENGINERSINEngineers India Limited | Weekly | ▲ Broken out | ₹282 | ₹265 | broken | ₹313 (+11%) | 5 |
| WONDERLAWonderla Holidays Limited | Weekly | ▲ Broken out | ₹539 | ₹522 | broken | ₹589 (+9%) | 5 |
| MANYAVARVedant Fashions Limited | Weekly | ▲ Broken out | ₹544 | ₹457 | broken | ₹497 met | 5 |
| HARSHAHarsha Engineers International Limited | Weekly | ▲ Broken out | ₹450 | ₹431 | broken | ₹504 (+12%) | 5 |
| ENDURANCEEndurance Technologies Limited | Weekly | ▲ Broken out | ₹2,864 | ₹2,771 | broken | ₹3,135 (+9%) | 5 |
| TITANTitan Company Limited | Weekly | ▲ Broken out | ₹5,044 | ₹4,605 | broken | ₹5,385 (+7%) | 5 |
| APLAPOLLOAPL Apollo Tubes Limited | Daily | ▲ Broken out | ₹2,245 | ₹1,930 | broken | ₹2,038 met | 5 |
| JINDALSTELJINDAL STEEL LIMITED | Daily | ▲ Broken out | ₹1,169 | ₹1,074 | broken | ₹1,138 met | 5 |
| LTFOODSLT Foods Limited | Weekly | Bullish | ₹440 | ₹440 | 0.0% | ≈₹521 (+18%) | 5 |
| BIRETBrookfield India Real Estate Trust | Daily | Bullish | ₹342 | ₹342 | 0.1% | ≈₹372 (+9%) | 5 |
| PNBPunjab National Bank | Weekly | Bullish | ₹116 | ₹116 | 0.1% | ≈₹133 (+15%) | 5 |
See every triple bottom found today →
How these are found: swing highs and lows are picked out with a percentage ZigZag on daily and weekly candles, and the boundaries are line-fitted through those swings. A formation is only published when the fit is tight, the boundaries are actually touched several times, and the price action stays inside them. The most recent swing is provisional, so a forming pattern can still change shape on the next candle, and patterns whose break already played out are dropped rather than shown as fresh. Levels and targets are the textbook measured moves, not forecasts. This is auto-generated market data, not investment advice.
