
SHRIRAMFIN — Rising Wedge
Shriram Finance Limited · Price grinding higher inside two rising lines that are closing together — an advance running out of air.
Rising Wedge · Weekly candles
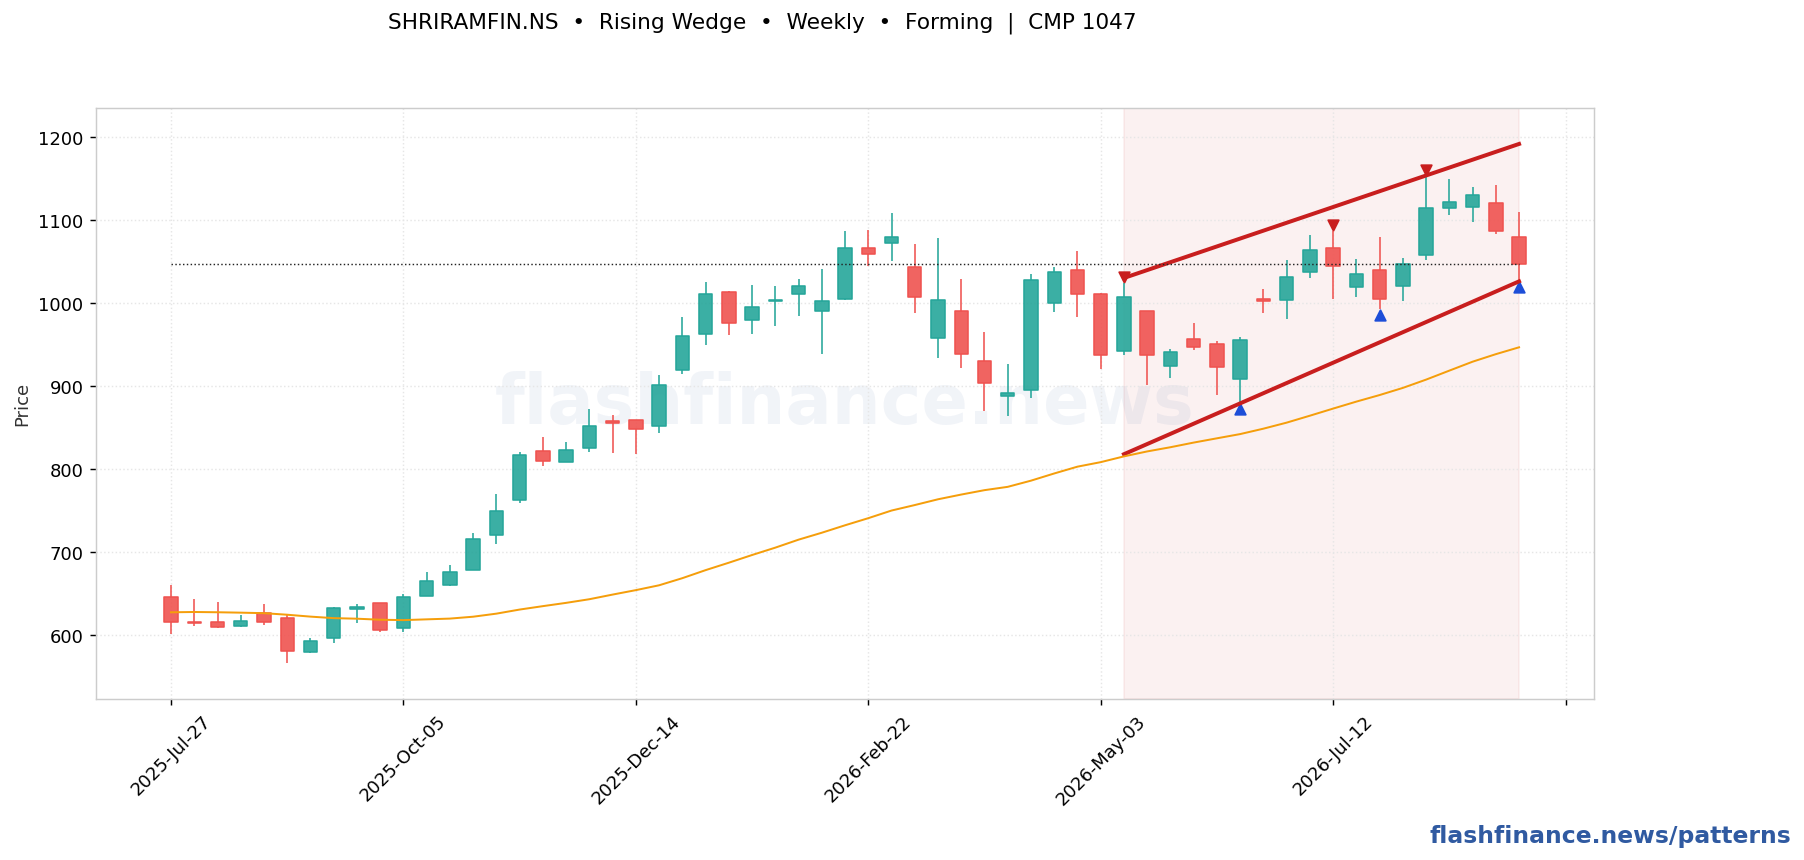
Trigger. A close below the rising lower boundary.
Target. Project the height of the wedge at its widest down from the break. Wedges often retrace the whole move that built them.
Invalidation. A decisive close above the upper boundary, which turns the wedge into an ordinary acceleration.
| Stock | TF | State | CMP | Trigger | Away | Target | Touches |
|---|---|---|---|---|---|---|---|
| CDSLCentral Depository Services (India) Limited | Weekly | Bearish | ₹1,365 | ₹1,356 | 0.7% | ≈₹1,025 (-25%) | 8 |
| BIOCONBiocon Limited | Weekly | Bearish | ₹401 | ₹398 | 0.8% | ≈₹319 (-20%) | 5 |
| APOLLOHOSPApollo Hospitals Enterprise Limited | Daily | Bearish | ₹8,719 | ₹8,640 | 0.9% | ≈₹7,417 (-15%) | 6 |
| AARTIINDAarti Industries Limited | Weekly | Bearish | ₹505 | ₹500 | 1.1% | ≈₹410 (-19%) | 6 |
| DALBHARATDalmia Bharat Limited | Weekly | Bearish | ₹1,773 | ₹1,747 | 1.5% | ≈₹1,468 (-17%) | 6 |
| AUROPHARMAAurobindo Pharma Limited | Daily | Bearish | ₹1,648 | ₹1,622 | 1.6% | ≈₹1,426 (-13%) | 8 |
| HCGHealthcare Global Enterprises Limited | Weekly | Bearish | ₹699 | ₹688 | 1.7% | ≈₹517 (-26%) | 5 |
| INDIANBIndian Bank | Daily | Bearish | ₹879 | ₹864 | 1.7% | ≈₹777 (-12%) | 7 |
| GRASIMGrasim Industries Limited | Daily | Bearish | ₹3,295 | ₹3,236 | 1.8% | ≈₹2,864 (-13%) | 7 |
| BAJAJHLDNGBajaj Holdings & Investment Limited | Weekly | Bearish | ₹11,100 | ₹10,872 | 2.0% | ≈₹8,448 (-24%) | 7 |
| MEDANTAGlobal Health Limited | Weekly | Bearish | ₹1,445 | ₹1,415 | 2.1% | ≈₹1,176 (-19%) | 6 |
| SUNPHARMASun Pharmaceutical Industries Limited | Weekly | Bearish | ₹1,932 | ₹1,892 | 2.1% | ≈₹1,566 (-19%) | 4 |
See every rising wedge found today →
How these are found: swing highs and lows are picked out with a percentage ZigZag on daily and weekly candles, and the boundaries are line-fitted through those swings. A formation is only published when the fit is tight, the boundaries are actually touched several times, and the price action stays inside them. The most recent swing is provisional, so a forming pattern can still change shape on the next candle, and patterns whose break already played out are dropped rather than shown as fresh. Levels and targets are the textbook measured moves, not forecasts. This is auto-generated market data, not investment advice.
