
VRLLOG — Inverse Head and Shoulders
VRL Logistics Limited · Three troughs with the middle one deepest — the classic bottoming pattern.
Inverse Head and Shoulders · Weekly candles
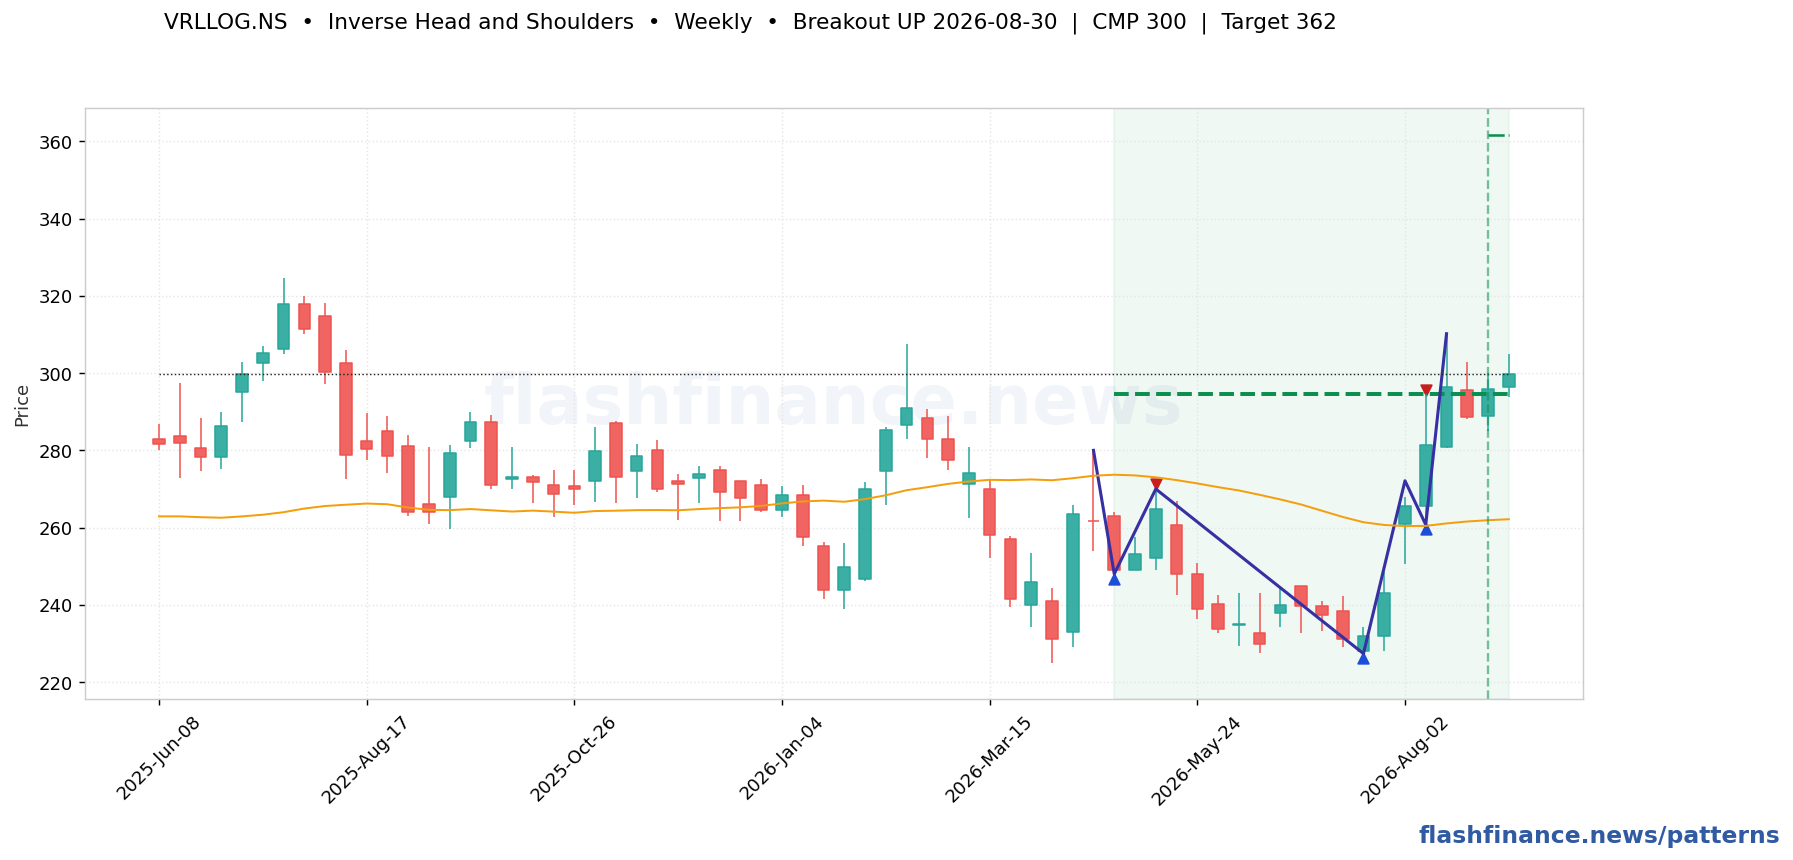
Trigger. A close above the neckline, ideally on rising volume.
Target. Measure from the bottom of the head up to the neckline and project that distance above the break point.
Invalidation. A close below the right shoulder, and certainly below the head.
| Stock | TF | State | CMP | Trigger | Away | Target | Touches |
|---|---|---|---|---|---|---|---|
| PGINVITPOWERGRID Infrastructure Investment Trust | Weekly | ▲ Broken out | ₹100 | ₹97.19 | broken | ₹121 (+21%) | 5 |
| APLAPOLLOAPL Apollo Tubes Limited | Weekly | ▲ Broken out | ₹2,245 | ₹1,991 | broken | ₹2,266 (+1%) | 5 |
| ASHOKLEYAshok Leyland Limited | Weekly | ▲ Broken out | ₹175 | ₹168 | broken | ₹197 (+13%) | 5 |
| SAGILITYSAGILITY LIMITED | Weekly | Bullish | ₹46.40 | ₹46.62 | 0.5% | ≈₹53.88 (+16%) | 5 |
| MAHSCOOTERMaharashtra Scooters Limited | Weekly | Bullish | ₹13,674 | ₹13,595 | 0.6% | ≈₹15,940 (+17%) | 5 |
| AJANTPHARMAjanta Pharma Limited | Weekly | Bullish | ₹3,544 | ₹3,507 | 1.0% | ≈₹4,164 (+18%) | 5 |
| GLENMARKGlenmark Pharmaceuticals Limited | Weekly | Bullish | ₹2,488 | ₹2,546 | 2.3% | ≈₹2,903 (+17%) | 5 |
| MFSLMax Financial Services Limited | Daily | Bullish | ₹1,547 | ₹1,598 | 3.3% | ≈₹1,755 (+13%) | 5 |
| ASTRALAstral Limited | Weekly | Bullish | ₹1,527 | ₹1,596 | 4.5% | ≈₹1,891 (+24%) | 5 |
| DEEPAKNTRDeepak Nitrite Limited | Weekly | Bullish | ₹1,812 | ₹1,898 | 4.7% | ≈₹2,262 (+25%) | 5 |
| PRAJINDPraj Industries Limited | Weekly | Bullish | ₹343 | ₹359 | 4.7% | ≈₹423 (+23%) | 5 |
| CASTROLINDCastrol India Limited | Daily | Bullish | ₹186 | ₹196 | 5.5% | ≈₹217 (+17%) | 5 |
See every inverse head and shoulders found today →
How these are found: swing highs and lows are picked out with a percentage ZigZag on daily and weekly candles, and the boundaries are line-fitted through those swings. A formation is only published when the fit is tight, the boundaries are actually touched several times, and the price action stays inside them. The most recent swing is provisional, so a forming pattern can still change shape on the next candle, and patterns whose break already played out are dropped rather than shown as fresh. Levels and targets are the textbook measured moves, not forecasts. This is auto-generated market data, not investment advice.
