
TATACAP — Triple Top
Tata Capital Limited · Three failed attempts at the same high — heavier supply than a double top.
Triple Top · Daily candles
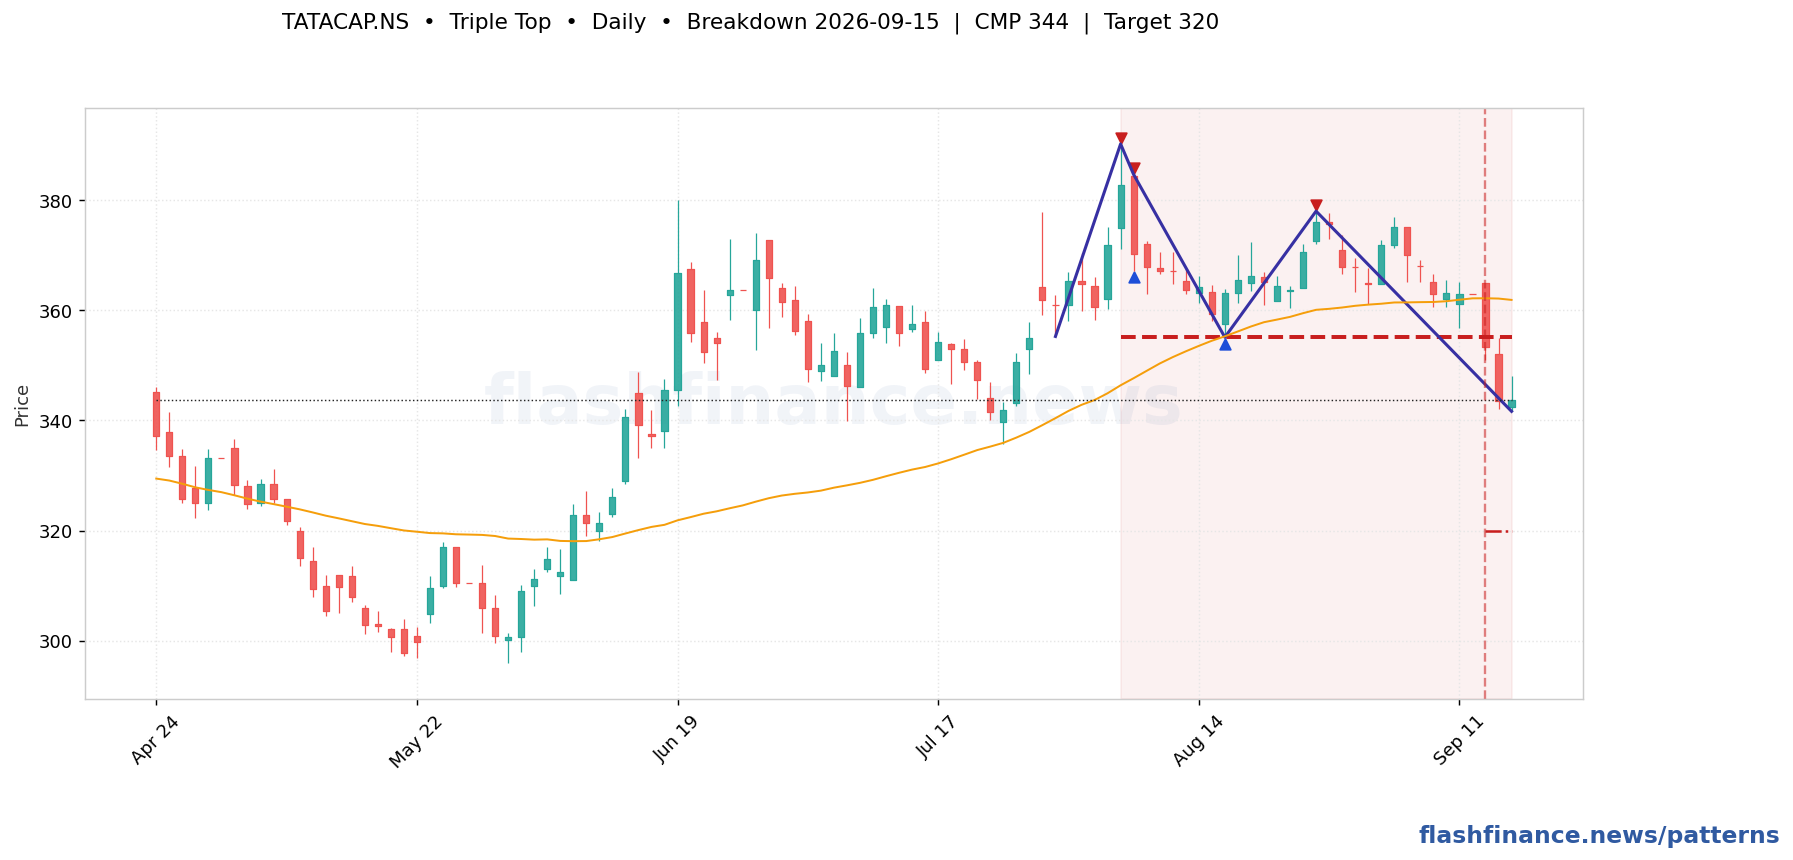
Trigger. A close below the neckline drawn through the intervening lows.
Target. Project the height from the peaks to the neckline down from the break.
Invalidation. A close above the three peaks — a level tested three times and then cleared is a strong bullish signal.
| Stock | TF | State | CMP | Trigger | Away | Target | Touches |
|---|---|---|---|---|---|---|---|
| GODREJCPGodrej Consumer Products Limited | Weekly | ▼ Broken down | ₹873 | ₹975 | broken | ₹803 (-8%) | 5 |
| METROBRANDMetro Brands Limited | Weekly | ▼ Broken down | ₹950 | ₹975 | broken | ₹822 (-14%) | 5 |
| CIEINDIACIE Automotive India Limited | Weekly | ▼ Broken down | ₹386 | ₹426 | broken | ₹348 (-10%) | 5 |
| RELIANCEReliance Industries Limited | Weekly | ▼ Broken down | ₹1,244 | ₹1,290 | broken | ₹1,090 (-12%) | 5 |
| ULTRACEMCOUltraTech Cement Limited | Weekly | ▼ Broken down | ₹10,764 | ₹10,964 | broken | ₹9,278 (-14%) | 5 |
| POLYCABPolycab India Limited | Daily | ▼ Broken down | ₹8,208 | ₹8,964 | broken | ₹8,064 (-2%) | 5 |
| PGHHProcter & Gamble Hygiene and Health Care Limited | Weekly | ▼ Broken down | ₹7,613 | ₹8,979 | broken | ₹7,359 (-3%) | 5 |
| JSWSTEELJSW Steel Limited | Daily | ▼ Broken down | ₹1,253 | ₹1,278 | broken | ₹1,182 (-6%) | 5 |
| HEIDELBERGHeidelbergCement India Limited | Weekly | ▼ Broken down | ₹142 | ₹145 | broken | ₹124 (-12%) | 5 |
| TCITransport Corporation of India Limited | Weekly | ▼ Broken down | ₹827 | ₹868 | broken | ₹717 (-13%) | 5 |
| V2RETAILV2 Retail Limited | Weekly | ▼ Broken down | ₹210 | ₹214 | broken | ₹169 (-20%) | 5 |
| AMBUJACEMAmbuja Cements Limited | Weekly | ▼ Broken down | ₹383 | ₹405 | broken | ₹341 (-11%) | 5 |
See every triple top found today →
How these are found: swing highs and lows are picked out with a percentage ZigZag on daily and weekly candles, and the boundaries are line-fitted through those swings. A formation is only published when the fit is tight, the boundaries are actually touched several times, and the price action stays inside them. The most recent swing is provisional, so a forming pattern can still change shape on the next candle, and patterns whose break already played out are dropped rather than shown as fresh. Levels and targets are the textbook measured moves, not forecasts. This is auto-generated market data, not investment advice.
