
GMDCLTD — Descending Channel
Gujarat Mineral Development Corporation Limited · A steady downtrend held between two parallel falling lines.
Descending Channel · Weekly candles
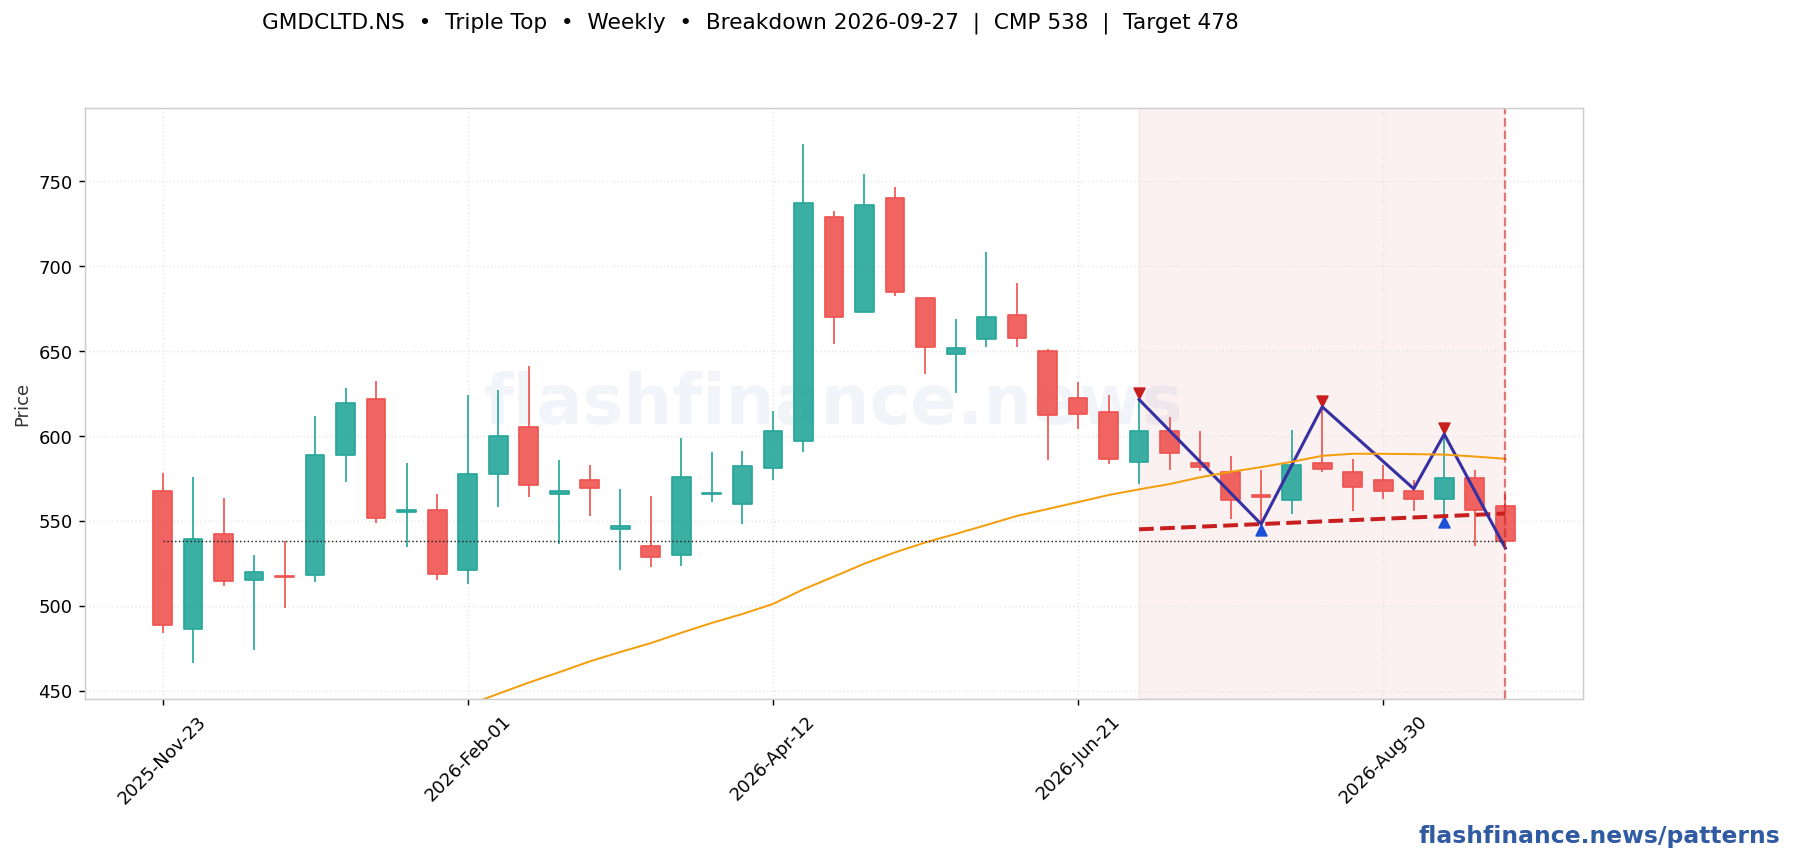
Trigger. A close above the upper rail is the first real sign the downtrend is ending. A close below the lower rail is capitulation.
Target. While the channel holds, the opposite rail. On an upside break, project the channel width up from the break.
Invalidation. A sustained close above the upper rail.
| Stock | TF | State | CMP | Trigger | Away | Target | Touches |
|---|---|---|---|---|---|---|---|
| IRBIRB Infrastructure Developers Limited | Weekly | Bearish | ₹18.10 | ₹18.02 | 0.4% | ≈₹15.84 (-12%) | 7 |
| VINATIORGAVinati Organics Limited | Weekly | Bearish | ₹1,222 | ₹1,216 | 0.5% | ≈₹1,066 (-13%) | 8 |
| TCITransport Corporation of India Limited | Daily | Bearish | ₹807 | ₹801 | 0.8% | ≈₹738 (-9%) | 5 |
| DOMSDOMS Industries Limited | Daily | Bearish | ₹2,083 | ₹2,048 | 1.7% | ≈₹1,869 (-10%) | 8 |
| KPITTECHKPIT Technologies Limited | Daily | Bearish | ₹537 | ₹526 | 1.9% | ≈₹482 (-10%) | 8 |
| BLUEDARTBlue Dart Express Limited | Daily | Bearish | ₹4,806 | ₹4,712 | 2.0% | ≈₹4,385 (-9%) | 5 |
| GOKEXGokaldas Exports Limited | Weekly | Bearish | ₹695 | ₹681 | 2.0% | ≈₹582 (-16%) | 6 |
| PSBPunjab & Sind Bank | Daily | Bearish | ₹21.95 | ₹21.42 | 2.4% | ≈₹19.36 (-12%) | 8 |
| STARHEALTHStar Health and Allied Insurance Company Limited | Daily | Bearish | ₹543 | ₹529 | 2.6% | ≈₹474 (-13%) | 6 |
| VTLVardhman Textiles Limited | Weekly | Bearish | ₹554 | ₹539 | 2.8% | ≈₹439 (-21%) | 7 |
| CENTURYPLYCentury Plyboards (India) Limited | Daily | Bearish | ₹703 | ₹683 | 2.9% | ≈₹627 (-11%) | 7 |
| LTMLTIMindtree Limited | Daily | Bearish | ₹4,280 | ₹4,146 | 3.1% | ≈₹3,700 (-14%) | 7 |
See every descending channel found today →
How these are found: swing highs and lows are picked out with a percentage ZigZag on daily and weekly candles, and the boundaries are line-fitted through those swings. A formation is only published when the fit is tight, the boundaries are actually touched several times, and the price action stays inside them. The most recent swing is provisional, so a forming pattern can still change shape on the next candle, and patterns whose break already played out are dropped rather than shown as fresh. Levels and targets are the textbook measured moves, not forecasts. This is auto-generated market data, not investment advice.
