Vehicles on Indian Roads: 24.91 Cr, 1.06 Cr of Them Electric
How many vehicles India has on the road, from the national Vahan register: by vehicle type, by fuel and by state, with the electric fleet for every state.
India's vehicle fleet, 14 October 2026
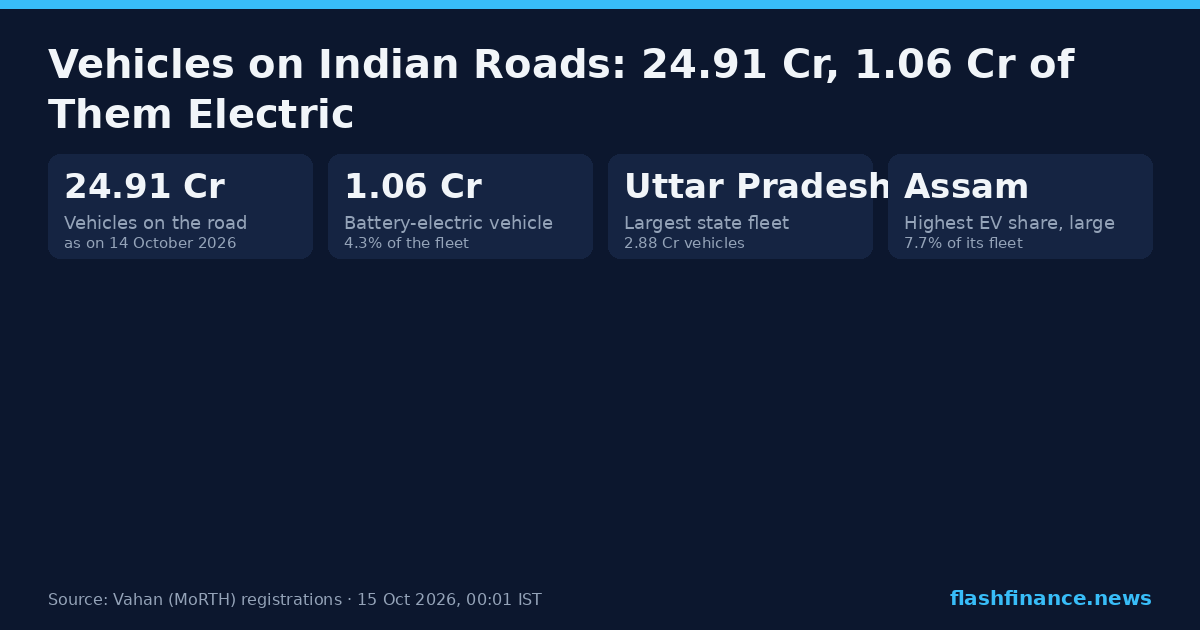
24,90,70,573 vehicles were active on the Vahan register as on 14 October 2026: every vehicle registered in India and not since scrapped, de-registered or archived. 1,06,22,463 of them, 4.3%, are battery electric.
This is a stock, not a flow. The monthly reports count vehicles registered in a month; this page counts what is still on the register. A vehicle bought in 2010 and still running is in it; one scrapped last year is not.
What is on the road
Two-wheelers make up 69.0% of the fleet. Vahan's light motor vehicle group is mostly private cars and jeeps, but tractors and other light vehicles are filed in it too, so it is shown under Vahan's own name.
Fleet by vehicle type, 14 October 2026
Groups of Vahan's own vehicle sub-categories.
| Type | Vehicles | Share |
|---|---|---|
| Two-wheelers | 17,18,31,302 | 69.0% |
| Light motor vehicles (private) | 5,47,27,034 | 22.0% |
| Light passenger vehicles (taxis, cabs) | 30,65,296 | 1.2% |
| Three-wheelers | 79,04,617 | 3.2% |
| Goods vehicles | 99,89,595 | 4.0% |
| Buses | 7,32,264 | 0.3% |
| Other | 8,20,454 | 0.3% |
Two-wheelers and three-wheelers include transport, non-transport and invalid-carriage registrations. Goods vehicles are light, medium and heavy; buses are medium and heavy passenger vehicles.
What it runs on
Petrol vehicles are 77.7% of the fleet and diesel 13.1%. Battery electrics are 4.3%: far below their share of new registrations, because the fleet turns over slowly.
| Fuel | Vehicles | Share |
|---|---|---|
| Petrol | 19,34,68,260 | 77.7% |
| Diesel | 3,26,89,893 | 13.1% |
| CNG / LPG | 95,68,483 | 3.8% |
| Electric | 1,06,22,463 | 4.3% |
| Hybrid | 20,42,265 | 0.8% |
| Other | 6,79,209 | 0.3% |
Hybrids are counted separately from battery electrics.
Every state
Uttar Pradesh has the largest fleet, 2,88,09,354 vehicles, followed by Maharashtra (2,56,34,135). Among states with at least 1% of the national fleet, Assam has the highest electric share, 7.7%.
| # | State | Vehicles | Share of India | Electric | EV share | CNG / LPG share |
|---|---|---|---|---|---|---|
| 1 | Uttar Pradesh | 2,88,09,354 | 11.6% | 18,47,278 | 6.4% | 4.1% |
| 2 | Maharashtra | 2,56,34,135 | 10.3% | 11,93,545 | 4.7% | 7.8% |
| 3 | Tamil Nadu | 2,01,13,029 | 8.1% | 7,27,848 | 3.6% | 2.1% |
| 4 | Karnataka | 1,91,29,622 | 7.7% | 9,33,172 | 4.9% | 2.9% |
| 5 | Gujarat | 1,72,58,357 | 6.9% | 4,23,956 | 2.5% | 9.9% |
| 6 | Kerala | 1,40,67,384 | 5.6% | 4,42,732 | 3.1% | 1.1% |
| 7 | Rajasthan | 1,34,40,011 | 5.4% | 5,82,145 | 4.3% | 3.7% |
| 8 | Madhya Pradesh | 1,26,97,911 | 5.1% | 5,23,679 | 4.1% | 2.7% |
| 9 | West Bengal | 1,10,64,022 | 4.4% | 3,56,247 | 3.2% | 1.3% |
| 10 | Andhra Pradesh | 1,08,46,848 | 4.4% | 2,86,858 | 2.6% | 1.0% |
| 11 | Bihar | 1,00,14,043 | 4.0% | 5,70,117 | 5.7% | 1.6% |
| 12 | Telangana | 92,17,519 | 3.7% | 3,67,149 | 4.0% | 2.2% |
| 13 | Haryana | 88,12,374 | 3.5% | 1,95,352 | 2.2% | 9.7% |
| 14 | Delhi | 72,24,774 | 2.9% | 5,46,622 | 7.6% | 12.5% |
| 15 | Punjab | 72,02,896 | 2.9% | 1,86,456 | 2.6% | 1.3% |
| 16 | Odisha | 69,06,573 | 2.8% | 3,51,212 | 5.1% | 0.6% |
| 17 | Chhattisgarh | 52,50,904 | 2.1% | 2,20,589 | 4.2% | 0.1% |
| 18 | Assam | 50,40,187 | 2.0% | 3,89,609 | 7.7% | 0.1% |
| 19 | Jharkhand | 50,28,599 | 2.0% | 1,43,649 | 2.9% | 0.9% |
| 20 | Uttarakhand | 26,23,856 | 1.1% | 1,16,230 | 4.4% | 1.6% |
| 21 | Jammu & Kashmir | 19,85,968 | 0.8% | 55,061 | 2.8% | 0.9% |
| 22 | Himachal Pradesh | 17,44,309 | 0.7% | 8,806 | 0.5% | 0.3% |
| 23 | Goa | 10,79,893 | 0.4% | 47,721 | 4.4% | 0.8% |
| 24 | Puducherry | 6,77,538 | 0.3% | 20,921 | 3.1% | 0.6% |
| 25 | Chandigarh | 6,48,045 | 0.3% | 27,477 | 4.2% | 1.5% |
| 26 | Tripura | 5,97,919 | 0.2% | 45,637 | 7.6% | 9.1% |
| 27 | Meghalaya | 3,90,392 | 0.2% | 2,700 | 0.7% | 0.0% |
| 28 | Mizoram | 2,85,004 | 0.1% | 2,740 | 1.0% | 0.0% |
| 29 | Arunachal Pradesh | 2,75,657 | 0.1% | 329 | 0.1% | 0.1% |
| 30 | Nagaland | 2,54,054 | 0.1% | 127 | 0.0% | 0.6% |
| 31 | Manipur | 2,37,005 | 0.1% | 4,222 | 1.8% | 0.1% |
| 32 | UT of DNH and DD | 2,16,799 | 0.1% | 1,351 | 0.6% | 5.4% |
| 33 | Andaman & Nicobar Island | 1,20,966 | 0.0% | 563 | 0.5% | 0.0% |
| 34 | Sikkim | 1,18,508 | 0.0% | 42 | 0.0% | 0.0% |
| 35 | Ladakh | 41,188 | 0.0% | 108 | 0.3% | 0.1% |
| 36 | Lakshadweep | 14,930 | 0.0% | 213 | 1.4% | 0.1% |
Frequently asked questions
How many vehicles are there in India?
How many electric vehicles are on Indian roads?
Which state has the most vehicles?
Where does this data come from?
More from the reports desk
Source. Every figure counts vehicles on the register, not sales: active vehicles as on the snapshot date, from the Ministry of Road Transport & Highways' Vahan Public Dashboard (analytics.parivahan.gov.in), read weekly and published only when its fuel, vehicle-type and state totals agree. Scrapped, de-registered and archived vehicles are not counted. "Electric" means battery electric; hybrids are counted separately. Information only, not investment advice.
Using these numbers? Cite "Flash Finance (Vahan data)" with a link to this page. This report's chart card is free to republish with the same credit.