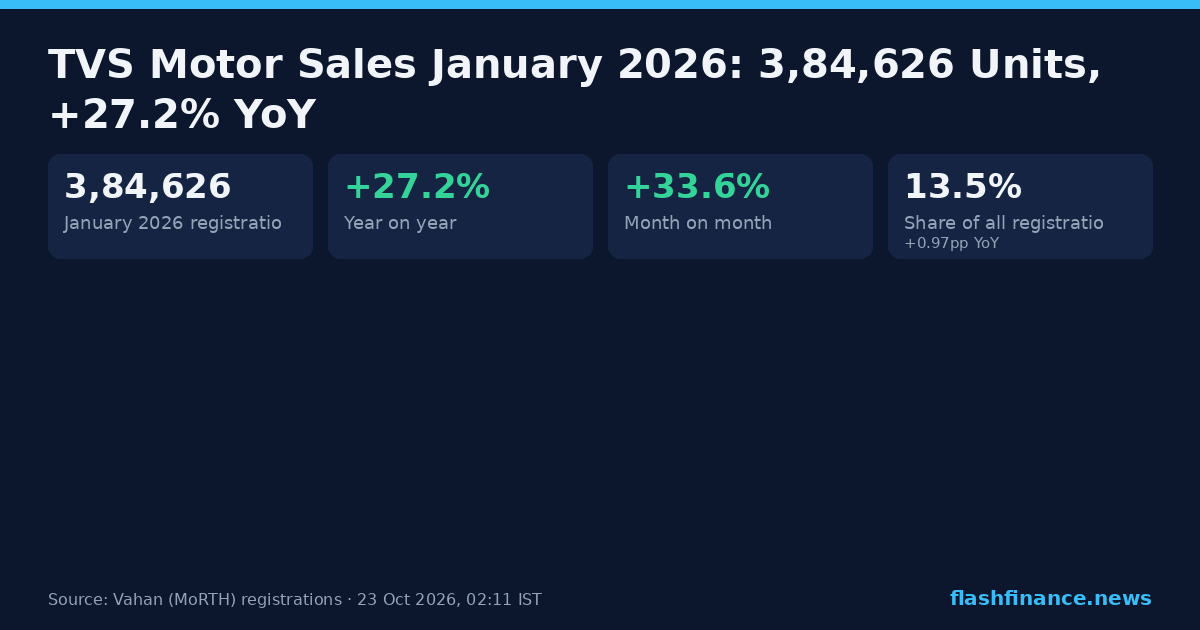
TVS Motor Sales January 2026: 3,84,626 Units, +27.2% YoY
Full Vahan registration report for TVS Motor in January 2026 — total volume, year-on-year and month-on-month change, where it ranks against every other manufacturer, and the segment and fuel mix behind the number.
TVS Motor in January 2026
TVS Motor registered 3,84,626 vehicles in India in January 2026. Volume jumped 27.2% against January 2025 and accelerated 33.6% against December. Its best month on record remains October 2025 at 5,78,599.
Of those, 3,76,712 were two-wheelers (97.9% of the total), +26.2% on January 2025. That figure is exact: it is counted with Vahan's own vehicle-class filter rather than worked out from the company total.
That put TVS Motor 3rd among every manufacturer registering vehicles in India in January 2026, behind Honda 2W (HMSI) on 4,94,675 and ahead of Bajaj Auto on 2,52,308.
Measured against every vehicle registered in India that month — all segments, all fuels — that is 13.5% of the market, +0.97pp against January 2025.
Across 2026 to date — the 1 months of the year that have closed — the company has registered 3,84,626 vehicles, +27.2% on the same months of 2025.
TVS Motor monthly registrations
Every calendar year on record, month by month. The dashed end of the current year is the month so far.
What TVS Motor sells
98.0% of everything TVS Motor has registered in 2026 is in two-wheelers, and the company holds 19.8% of that segment nationally. Three-wheelers is next at 1.7%.
This split is the calendar year to date and cannot be cut to a single month: our Vahan data holds a manufacturer's volume by month, and its volume by vehicle class, but not the two together. Multiplying them would be a guess, so the table stays on the axis where the number is exact.
TVS Motor by segment, 2026
Calendar year to date — exact, but with no month axis.
| Segment | 2026 units | Share of company | Share of segment |
|---|---|---|---|
| Two-Wheelers | 35,86,073 | 98.0% | 19.8% |
| Three-Wheelers | 63,336 | 1.7% | 5.3% |
| Other | 9,833 | 0.3% | 5.5% |
| Goods Carriers | 23 | 0.0% | 0.0% |
| Cars & UVs | 6 | 0.0% | 0.0% |
| Tractors | 1 | 0.0% | 0.0% |
"Share of segment" is this company against every other manufacturer in the same segment, over the same months.
Fuel mix
13.3% of TVS Motor's 2026 registrations are battery electric — 4,86,227 vehicles, against 8.5% in 2025.
Fuel, like segment, is published against the manufacturer for the whole year rather than by month, so these shares are 2026 to date. Hybrids are counted separately from battery electrics.
| Fuel | 2026 units | Share | vs 2025 |
|---|---|---|---|
| Petrol | 31,46,876 | 86.0% | −4.86pp |
| CNG / LPG | 26,167 | 0.7% | +0.04pp |
| Electric | 4,86,227 | 13.3% | +4.82pp |
| Other | 2 | 0.0% | 0.00pp |
Every manufacturer, January 2026
Ranked on total registrations across every vehicle type, which is the finest manufacturer split our Vahan data holds with a month axis. Two-wheeler makers therefore sit above carmakers selling far more value — this is a count of vehicles, not of revenue.
| # | Manufacturer | Jan 2026 | Share of market |
|---|---|---|---|
| 1 | Hero MotoCorp | 5,01,562 | 17.6% |
| 2 | Honda 2W (HMSI) | 4,94,675 | 17.4% |
| 3 | TVS Motor | 3,84,626 | 13.5% |
| 4 | Bajaj Auto | 2,52,308 | 8.9% |
| 5 | Maruti Suzuki | 2,31,695 | 8.1% |
| 6 | Mahindra & Mahindra | 1,48,414 | 5.2% |
| 7 | Royal Enfield | 1,12,327 | 3.9% |
| 8 | Tata Motors | 1,06,767 | 3.8% |
| 9 | Suzuki 2W | 1,04,893 | 3.7% |
| 10 | Hyundai | 69,663 | 2.4% |
| 11 | Yamaha India | 66,221 | 2.3% |
| 12 | Toyota Kirloskar | 38,353 | 1.3% |
| 13 | Kia India | 32,459 | 1.1% |
| 14 | Ather Energy | 23,487 | 0.8% |
| 15 | Ashok Leyland | 19,944 | 0.7% |
TVS Motor month by month
The last 15 months on record. The year-on-year column compares each month against the same month a year earlier; the running month is left without one.
| Month | Registrations | YoY |
|---|---|---|
| October 2026 (live) | 2,78,087 | — |
| September 2026 | 3,74,454 | +43.2% |
| August 2026 | 3,63,770 | +26.5% |
| July 2026 | 3,84,337 | +34.7% |
| June 2026 | 3,68,724 | +24.2% |
| May 2026 | 3,65,772 | +12.9% |
| April 2026 | 3,88,158 | +19.7% |
| March 2026 | 3,94,870 | +34.1% |
| February 2026 | 3,56,474 | +33.1% |
| January 2026 | 3,84,626 | +27.2% |
| December 2025 | 2,87,833 | +27.3% |
| November 2025 | 4,69,668 | +6.9% |
| October 2025 | 5,78,599 | +58.4% |
| September 2025 | 2,61,460 | +12.4% |
| August 2025 | 2,87,508 | +16.1% |
Frequently asked questions
How many vehicles did TVS Motor sell in January 2026?
Where does TVS Motor rank in January 2026?
What does TVS Motor mostly sell?
How many of TVS Motor's vehicles are electric?
Are these retail sales or factory dispatches?
TVS Motor sales, earlier months
More from the reports desk
Source. Every figure is a vehicle registration, taken daily from the Ministry of Road Transport & Highways' Vahan 4 dashboard (vahan.parivahan.gov.in) — the same source FADA and the industry use for retail data. Registrations are not the wholesale dispatch numbers manufacturers announce each month. "EV" means battery electric (Vahan fuels PURE EV and ELECTRIC(BOV)); hybrids are counted separately. Information only, not investment advice.
Using these numbers? Cite "Flash Finance (Vahan data)" with a link to this page. This report's chart card is free to republish with the same credit.