
GREENLAM — Triple Top
Greenlam Industries Limited · Three failed attempts at the same high — heavier supply than a double top.
Triple Top · Weekly candles
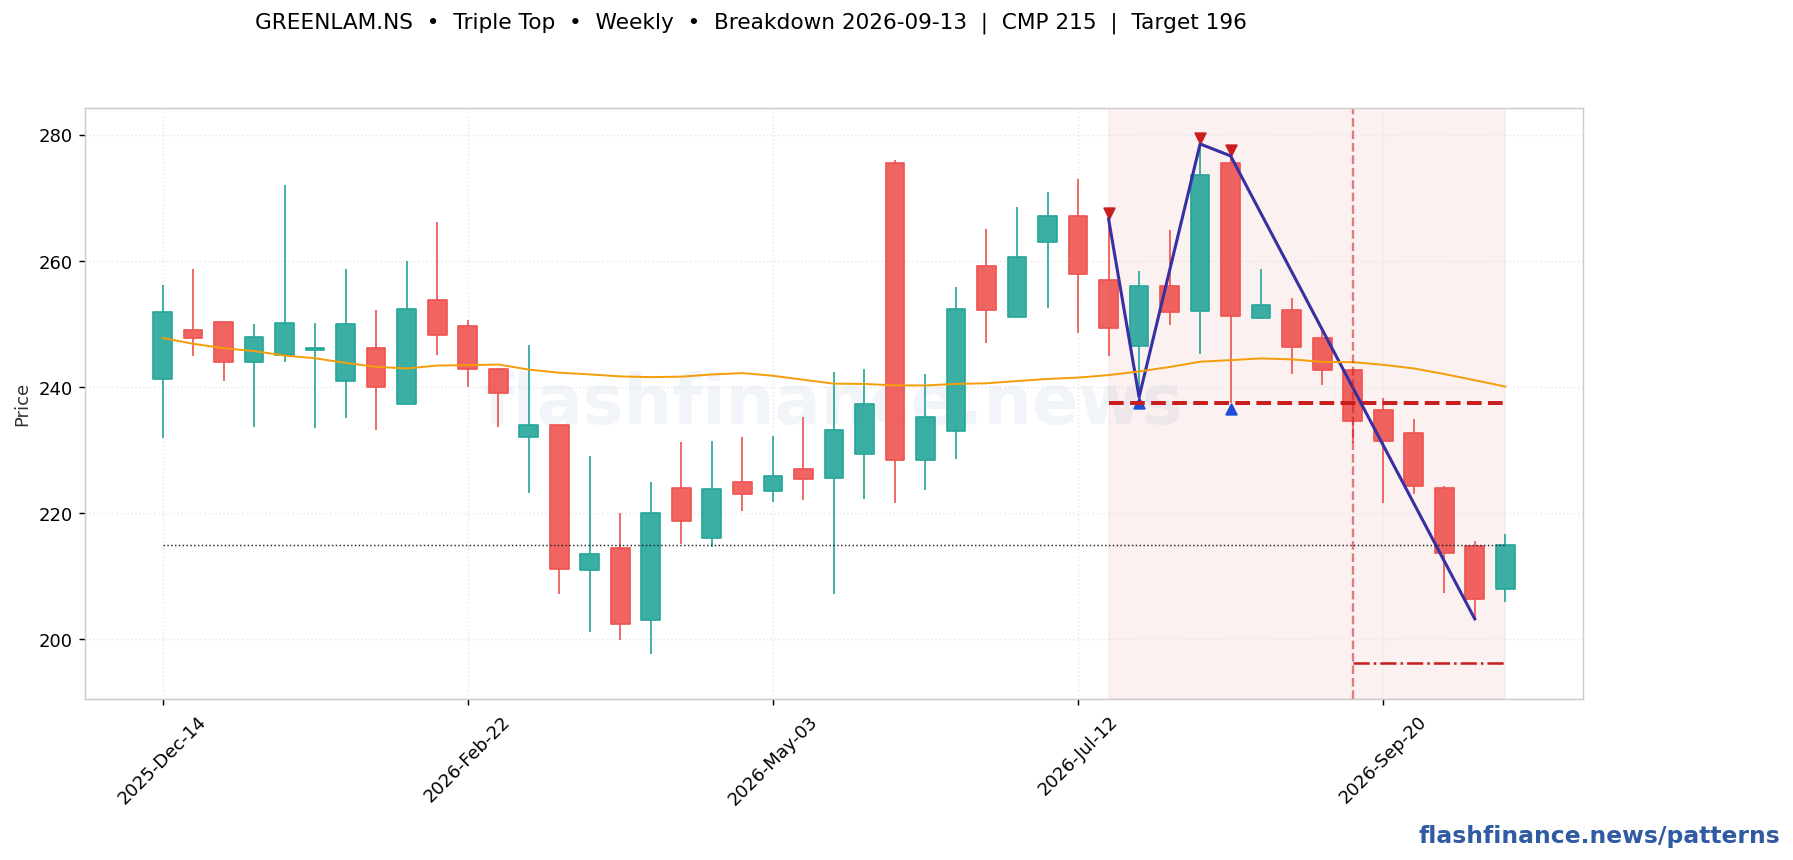
Trigger. A close below the neckline drawn through the intervening lows.
Target. Project the height from the peaks to the neckline down from the break.
Invalidation. A close above the three peaks — a level tested three times and then cleared is a strong bullish signal.
Shows the chart pattern on any stock we chart, or tells you there isn't one today.
| Stock | TF | State | CMP | Trigger | Away | Target | Touches |
|---|---|---|---|---|---|---|---|
| BLUEDARTBlue Dart Express Limited | Weekly | ▼ Broken down | ₹4,390.90 | ₹4,628.50 | broken | ₹3,328.00 (-24%) | 5 |
| CENTURYPLYCentury Plyboards (India) Limited | Weekly | ▼ Broken down | ₹673.15 | ₹713.00 | broken | ₹590.05 (-12%) | 5 |
| GODREJCPGodrej Consumer Products Limited | Weekly | ▼ Broken down | ₹855.00 | ₹975.40 | broken | ₹802.80 (-6%) | 5 |
| ALKEMAlkem Laboratories Limited | Weekly | ▼ Broken down | ₹5,050.00 | ₹5,162.50 | broken | ₹4,442.50 (-12%) | 5 |
| SCHAEFFLERSchaeffler India Limited | Weekly | ▼ Broken down | ₹3,669.20 | ₹3,820.10 | broken | ₹3,202.70 (-13%) | 5 |
| JKILJ.Kumar Infraprojects Limited | Weekly | ▼ Broken down | ₹442.15 | ₹454.50 | broken | ₹387.45 (-12%) | 5 |
| INDIGOInterGlobe Aviation Limited | Weekly | ▼ Broken down | ₹4,686.90 | ₹4,886.00 | broken | ₹4,264.00 (-9%) | 5 |
| MUTHOOTFINMuthoot Finance Limited | Weekly | ▼ Broken down | ₹2,598.30 | ₹2,671.00 | broken | ₹2,095.50 (-19%) | 5 |
| RELIANCEReliance Industries Limited | Weekly | ▼ Broken down | ₹1,211.20 | ₹1,290.00 | broken | ₹1,090.50 (-10%) | 5 |
| SUNDARMFINSundaram Finance Limited | Weekly | ▼ Broken down | ₹4,236.80 | ₹4,343.00 | broken | ₹3,720.70 (-12%) | 5 |
| AARTIDRUGSAarti Drugs Limited | Weekly | ▼ Broken down | ₹396.35 | ₹424.50 | broken | ₹370.35 (-7%) | 5 |
| VIPINDVIP Industries Limited | Weekly | ▼ Broken down | ₹269.75 | ₹288.00 | broken | ₹246.35 (-9%) | 5 |
See every triple top found today →
📚 Today's chart books (PDF)
About the chart books →Educational only. Prepared with AI assistance and reviewed by our editors; still check prices and levels yourself. Not investment advice.
How these are found: swing highs and lows are picked out with a percentage ZigZag on daily and weekly candles, and the boundaries are line-fitted through those swings. A formation is only published when the fit is tight, the boundaries are actually touched several times, and the price action stays inside them. The most recent swing is provisional, so a forming pattern can still change shape on the next candle, and patterns whose break already played out are dropped rather than shown as fresh. Levels and targets are the textbook measured moves, not forecasts. This is auto-generated market data, not investment advice.
