Commercial Vehicle Sales December 2025: Tata Motors Leads, 87,224 Units Registered
Full Vahan registration report for December 2025 — every major manufacturer ranked, with month-on-month and year-on-year change, segment share, fuel mix and the state-wise picture.
How December went
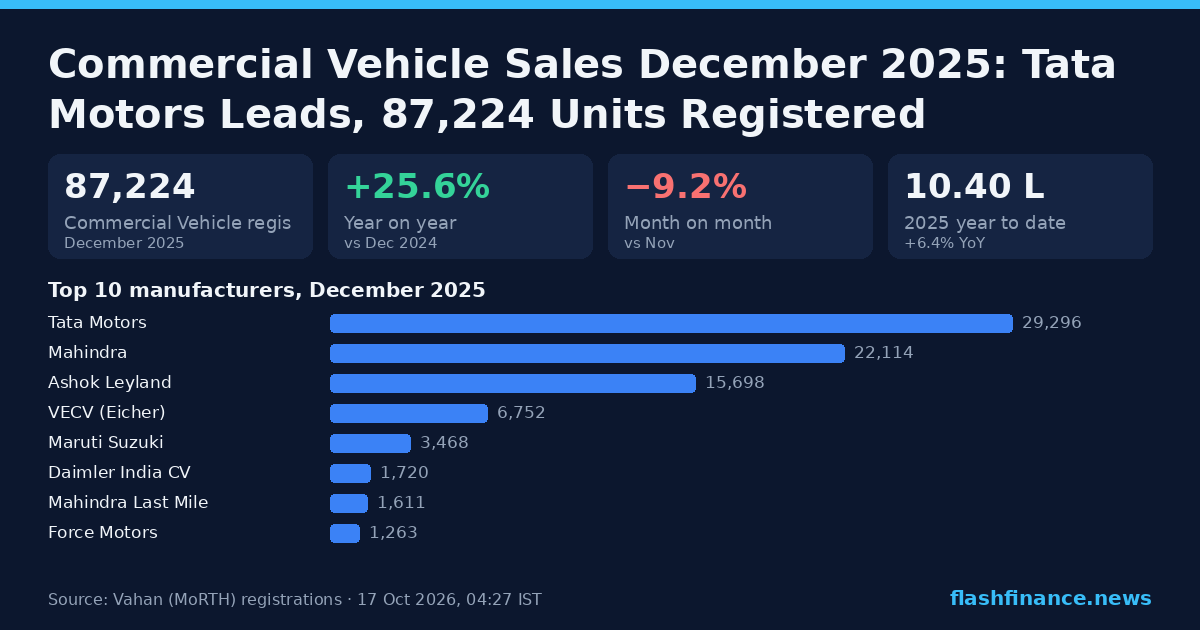
India's commercial-vehicle market registered 87,224 vehicles in December 2025. Volumes accelerated 25.6% against December 2024, and slipped 9.2% on November. It was the strongest December in that record.
That is 5 consecutive months of year-on-year growth for the segment. Year to date, 10,39,731 units have been registered across 12 months, +6.4% on the same stretch of 2024 (9,77,608). The segment accounted for 4.1% of every vehicle registered in India that month.
December is the year-end discount month, though many buyers hold registration to January to keep a newer model year on the RC.
Monthly commercial vehicle registrations, 2023–2026
One line per calendar year — the shape of the year, not just its total. The dashed end of the current year is the month so far.
Manufacturer scoreboard
Tata Motors led the segment with 29,296 registrations, ahead of Mahindra on 22,114 — a gap of 7,182 units, wider than the 5,297 it held in November.
VECV (Eicher) grew fastest among the segment's biggest names at +44.4% year on year (6,752 units).
On share rather than volume — the number that decides who is actually winning — Mahindra has added 1.88pp of the segment in 2025, while Tata Motors has given up 2.51pp.
Top 10 manufacturers, December 2025
Registrations in the month
Ranked by registrations in the month, with month-on-month and year-on-year change. Click a name for its full dashboard.
| # | Manufacturer | Dec 2025 | MoM | YoY | Share of commercial vehicles |
|---|---|---|---|---|---|
| 1 | Tata Motors | 29,296 | −9.0% | +22.9% | 33.59% |
| 2 | Mahindra | 22,114 | −17.8% | +21.3% | 25.35% |
| 3 | Ashok Leyland | 15,698 | −2.2% | +30.1% | 18.00% |
| 4 | VECV (Eicher) | 6,752 | −5.5% | +44.4% | 7.74% |
| 5 | Maruti Suzuki | 3,468 | −12.6% | +13.4% | 3.98% |
| 6 | Daimler India CV | 1,720 | +6.1% | +14.1% | 1.97% |
| 7 | Mahindra Last Mile | 1,611 | −26.8% | +15.1% | 1.85% |
| 8 | Force Motors | 1,263 | −3.4% | +39.4% | 1.45% |
| 9 | Others | 843 | −4.9% | −11.4% | 0.97% |
| 10 | SML Mahindra | 840 | +16.0% | +68.0% | 0.96% |
| 11 | Local Trailer Manufacturer | 678 | +125.2% | +30.4% | 0.78% |
| 12 | Switch Mobility | 324 | +159.2% | +234.0% | 0.37% |
| 13 | Toyota Kirloskar | 313 | −2.8% | +15.1% | 0.36% |
| 14 | Euler Motors | 289 | +9.9% | +4716.7% | 0.33% |
| 15 | Isuzu India | 179 | +5.3% | +8.5% | 0.21% |
Registrations inside the segment only, counted with Vahan's own vehicle-class filter, so each number is that manufacturer's commercial vehicle volume. Companies that file electric models under a maker of their own (Tata, Mahindra) appear as separate rows.
Market share, year to date
Share is measured inside the segment itself — only commercial vehicle volume counts on either side of the ratio. Volume is full-year 2025. The comparison is against the whole of 2024.
Exact segment volume per manufacturer over full-year 2025, and the change in share against full-year 2024.
| # | Manufacturer | 2025 units | Share | vs full-year 2024 |
|---|---|---|---|---|
| 1 | Tata Motors | 3,38,044 | 32.51% | −2.51pp |
| 2 | Mahindra | 2,75,246 | 26.47% | +1.88pp |
| 3 | Ashok Leyland | 1,86,024 | 17.89% | +0.12pp |
| 4 | VECV (Eicher) | 84,795 | 8.16% | +0.35pp |
| 5 | Maruti Suzuki | 42,052 | 4.04% | +0.12pp |
| 6 | Mahindra Last Mile | 20,515 | 1.97% | +0.03pp |
| 7 | Daimler India CV | 19,999 | 1.92% | −0.12pp |
| 8 | Force Motors | 19,341 | 1.86% | +0.11pp |
| 9 | SML Mahindra | 12,147 | 1.17% | 0.00pp |
| 10 | Others | 8,854 | 0.85% | −0.44pp |
| 11 | Local Trailer Manufacturer | 5,147 | 0.50% | −0.06pp |
| 12 | Toyota Kirloskar | 4,369 | 0.42% | −0.06pp |
| 13 | Isuzu India | 3,076 | 0.30% | +0.02pp |
| 14 | Switch Mobility | 1,901 | 0.18% | +0.14pp |
| 15 | Olectra Greentech | 1,192 | 0.11% | +0.03pp |
Fuel mix
Diesel accounts for 81.0% of the segment's registrations in 2025. Electric is at 1.58%, a move of +0.50pp on 2024 on volume of 16,460 units.
Commercial Vehicle fuel mix, 2025
Share of segment registrations year to date
The full-year 2025 mix.
| Fuel | 2025 units | Share | vs full-year 2024 |
|---|---|---|---|
| Diesel | 8,42,575 | 81.04% | −0.22pp |
| CNG / LPG | 1,19,433 | 11.49% | +1.32pp |
| Petrol | 38,345 | 3.69% | −1.38pp |
| Other | 22,187 | 2.13% | −0.21pp |
| Electric | 16,460 | 1.58% | +0.50pp |
| Hybrid | 731 | 0.07% | −0.01pp |
Share is of this report's own scope over full-year 2025, compared with the whole of 2024.
Where the demand is
Maharashtra was the largest market in full-year 2025 with 1,51,665 registrations, 14.6% of the segment's national total. Uttar Pradesh (83,108) and Gujarat (81,444) followed. Maharashtra has gained the most ground, adding 1.15pp of the national total.
Segment registrations over full-year 2025, by state.
| # | State | Units | Share | vs full-year 2024 |
|---|---|---|---|---|
| 1 | Maharashtra | 1,51,665 | 14.6% | +1.15pp |
| 2 | Uttar Pradesh | 83,108 | 8.0% | −0.40pp |
| 3 | Gujarat | 81,444 | 7.8% | +0.50pp |
| 4 | Karnataka | 76,236 | 7.3% | −0.32pp |
| 5 | Tamil Nadu | 74,911 | 7.2% | +0.05pp |
| 6 | Rajasthan | 69,869 | 6.7% | −0.06pp |
| 7 | Haryana | 67,620 | 6.5% | +0.68pp |
| 8 | Telangana | 46,849 | 4.5% | +0.14pp |
| 9 | West Bengal | 36,404 | 3.5% | 0.00pp |
| 10 | Madhya Pradesh | 36,365 | 3.5% | −0.05pp |
| 11 | Andhra Pradesh | 35,473 | 3.4% | −0.31pp |
| 12 | Bihar | 35,281 | 3.4% | +0.22pp |
Frequently asked questions
How many commercial vehicles were sold in India in December 2025?
Which company sold the most commercial vehicles in December 2025?
What is the commercial vehicle market share in India in 2025?
What share of commercial vehicles sold in India are electric?
Which state registers the most commercial vehicles in India?
Are these wholesale dispatches or retail sales?
Commercial Vehicle sales, earlier months
More from the reports desk
Source. Every figure is a vehicle registration, taken daily from the Ministry of Road Transport & Highways' Vahan 4 dashboard (vahan.parivahan.gov.in) — the same source FADA and the industry use for retail data. Registrations are not the wholesale dispatch numbers manufacturers announce each month. "EV" means battery electric (Vahan fuels PURE EV and ELECTRIC(BOV)); hybrids are counted separately. Information only, not investment advice.
Using these numbers? Cite "Flash Finance (Vahan data)" with a link to this page. This report's chart card is free to republish with the same credit.