Manipur Vehicle Registrations July 2026: 1,454 Units, −45.1% YoY
Full Vahan registration report for Manipur in July 2026 — total volume, year-on-year and month-on-month change, where the state ranks nationally, and the segment and fuel mix behind the number.
Manipur in July 2026
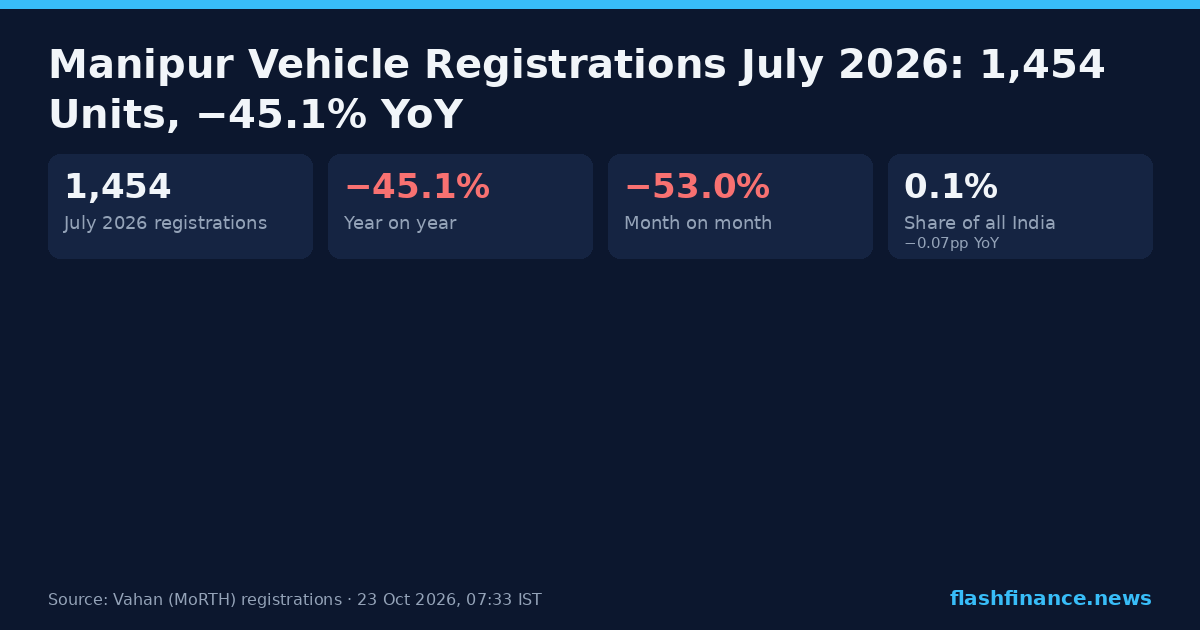
1,454 vehicles were registered in Manipur in July 2026. Volume tumbled 45.1% against July 2025 and collapsed 53.0% against June. Its best month on record remains November 2022 at 7,461.
That made Manipur the 32nd largest vehicle market in India in July 2026, behind Dadra & Nagar Haveli and Daman & Diu on 2,129 and ahead of Andaman & Nicobar Islands on 1,215.
That is 0.1% of every vehicle registered in the country that month, −0.07pp against July 2025.
Across 2026 to date — the 7 months of the year that have closed — Manipur has registered 22,720 vehicles, +33.5% on the same months of 2025.
Manipur monthly registrations
Every calendar year on record, month by month. The dashed end of the current year is the month so far.
What Manipur buys
76.9% of everything registered in Manipur in 2026 is two-wheelers, and the state accounts for 0.1% of that segment nationally. Against the national mix, Manipur skews towards two-wheelers — +6.18pp more of its book than India as a whole.
This split is the calendar year to date. Our Vahan data holds a state's registrations by month, and a state's registrations by vehicle class, but not the two together — so the volumes here cover 2026 rather than July 2026 alone. It holds no manufacturer-by-state table either, which is why no page here says which brand leads in Manipur.
Manipur by segment, 2026
Calendar year to date — exact, but with no month axis.
| Segment | 2026 units | Share of state | Share of segment | vs national mix |
|---|---|---|---|---|
| Two-Wheelers | 22,061 | 76.9% | 0.1% | +6.18pp |
| Cars & UVs | 4,804 | 16.7% | 0.1% | +1.49pp |
| Three-Wheelers | 1,017 | 3.5% | 0.1% | −1.13pp |
| Goods Carriers | 600 | 2.1% | 0.1% | −1.28pp |
| Other | 131 | 0.5% | 0.1% | −0.24pp |
| Tractors | 68 | 0.2% | 0.0% | −3.23pp |
| Taxis & Cabs | 6 | 0.0% | 0.0% | −1.37pp |
| Buses | 3 | 0.0% | 0.0% | −0.42pp |
"Share of segment" is this state against every other state in the same segment. "vs national mix" is how much more (or less) of this state's book the segment is than it is of India's.
What Manipur runs on
4.7% of Manipur's 2026 registrations are battery electric — 1,345 vehicles, against a national average of 10.7%. A year earlier the state was at 3.4%. CNG and LPG account for 0.0% here against 5.6% nationally.
Fuel, like segment, is published against the state for the whole calendar year rather than by month, so these shares are 2026 to date. Hybrids are counted separately from battery electrics.
| Fuel | 2026 units | Share in state | Share in India | vs 2025 |
|---|---|---|---|---|
| Petrol | 24,916 | 86.8% | 71.4% | −1.98pp |
| Diesel | 1,797 | 6.3% | 10.5% | +0.87pp |
| CNG / LPG | 2 | 0.0% | 5.6% | +0.01pp |
| Electric | 1,345 | 4.7% | 10.7% | +1.32pp |
| Hybrid | 630 | 2.2% | 1.4% | −0.22pp |
Every state, July 2026
Registrations by state for July 2026, exact and directly comparable — this is the one state table on the desk that has a real month axis behind it, so the year-on-year column compares the same month a year earlier rather than a part year against a whole one.
| # | State | Jul 2026 | Share of India | YoY |
|---|---|---|---|---|
| 1 | Uttar Pradesh | 3,10,422 | 11.8% | +25.7% |
| 2 | Maharashtra | 2,76,780 | 10.5% | +19.3% |
| 3 | Tamil Nadu | 2,49,590 | 9.5% | +38.4% |
| 4 | Gujarat | 2,12,280 | 8.1% | +39.3% |
| 5 | Karnataka | 1,86,137 | 7.1% | +37.0% |
| 6 | Rajasthan | 1,42,210 | 5.4% | +26.3% |
| 7 | Madhya Pradesh | 1,26,946 | 4.8% | +23.0% |
| 8 | West Bengal | 1,22,851 | 4.7% | +35.1% |
| 9 | Bihar | 1,15,417 | 4.4% | +20.6% |
| 10 | Telangana | 1,03,733 | 3.9% | +29.6% |
| 30 | Nagaland | 2,577 | 0.1% | +3.3% |
| 31 | Dadra & Nagar Haveli and Daman & Diu | 2,129 | 0.1% | +4.7% |
| 32 | Manipur | 1,454 | 0.1% | −45.1% |
| 33 | Andaman & Nicobar Islands | 1,215 | 0.0% | +37.1% |
| 34 | Sikkim | 1,116 | 0.0% | +13.1% |
Manipur month by month
The last 15 months on record for Manipur. The running month is left without a year-on-year figure.
| Month | Registrations | YoY |
|---|---|---|
| October 2026 (live) | 1,469 | — |
| September 2026 | 2,488 | −16.7% |
| August 2026 | 2,013 | −56.5% |
| July 2026 | 1,454 | −45.1% |
| June 2026 | 3,096 | +1.0% |
| May 2026 | 4,143 | +223.9% |
| April 2026 | 2,833 | −3.5% |
| March 2026 | 4,035 | +84.8% |
| February 2026 | 3,740 | +35.6% |
| January 2026 | 3,419 | +59.6% |
| December 2025 | 3,778 | +71.4% |
| November 2025 | 3,344 | +88.0% |
| October 2025 | 3,900 | +39.5% |
| September 2025 | 2,988 | +64.1% |
| August 2025 | 4,629 | +54.4% |
Frequently asked questions
How many vehicles were registered in Manipur in July 2026?
Where does Manipur rank among Indian states?
What kind of vehicles does Manipur buy?
What is the EV share in Manipur?
Which manufacturer sells the most in Manipur?
Are these retail sales or factory dispatches?
Manipur registrations, earlier months
More from the reports desk
Source. Every figure is a vehicle registration, taken daily from the Ministry of Road Transport & Highways' Vahan 4 dashboard (vahan.parivahan.gov.in) — the same source FADA and the industry use for retail data. Registrations are not the wholesale dispatch numbers manufacturers announce each month. "EV" means battery electric (Vahan fuels PURE EV and ELECTRIC(BOV)); hybrids are counted separately. Information only, not investment advice.
Using these numbers? Cite "Flash Finance (Vahan data)" with a link to this page. This report's chart card is free to republish with the same credit.