
Double Top Pattern
Two failed attempts at the same high, separated by a dip — the classic M.
Shows the chart pattern on any stock we chart, or tells you there isn't one today.
Showing 8 of 8. Trigger is the price a daily close must clear for the pattern to complete; Target is the measured move it projects, marked ≈ while the break has not happened yet.
| Stock | TF | State | CMP | Trigger | Away | Target | Touches |
|---|---|---|---|---|---|---|---|
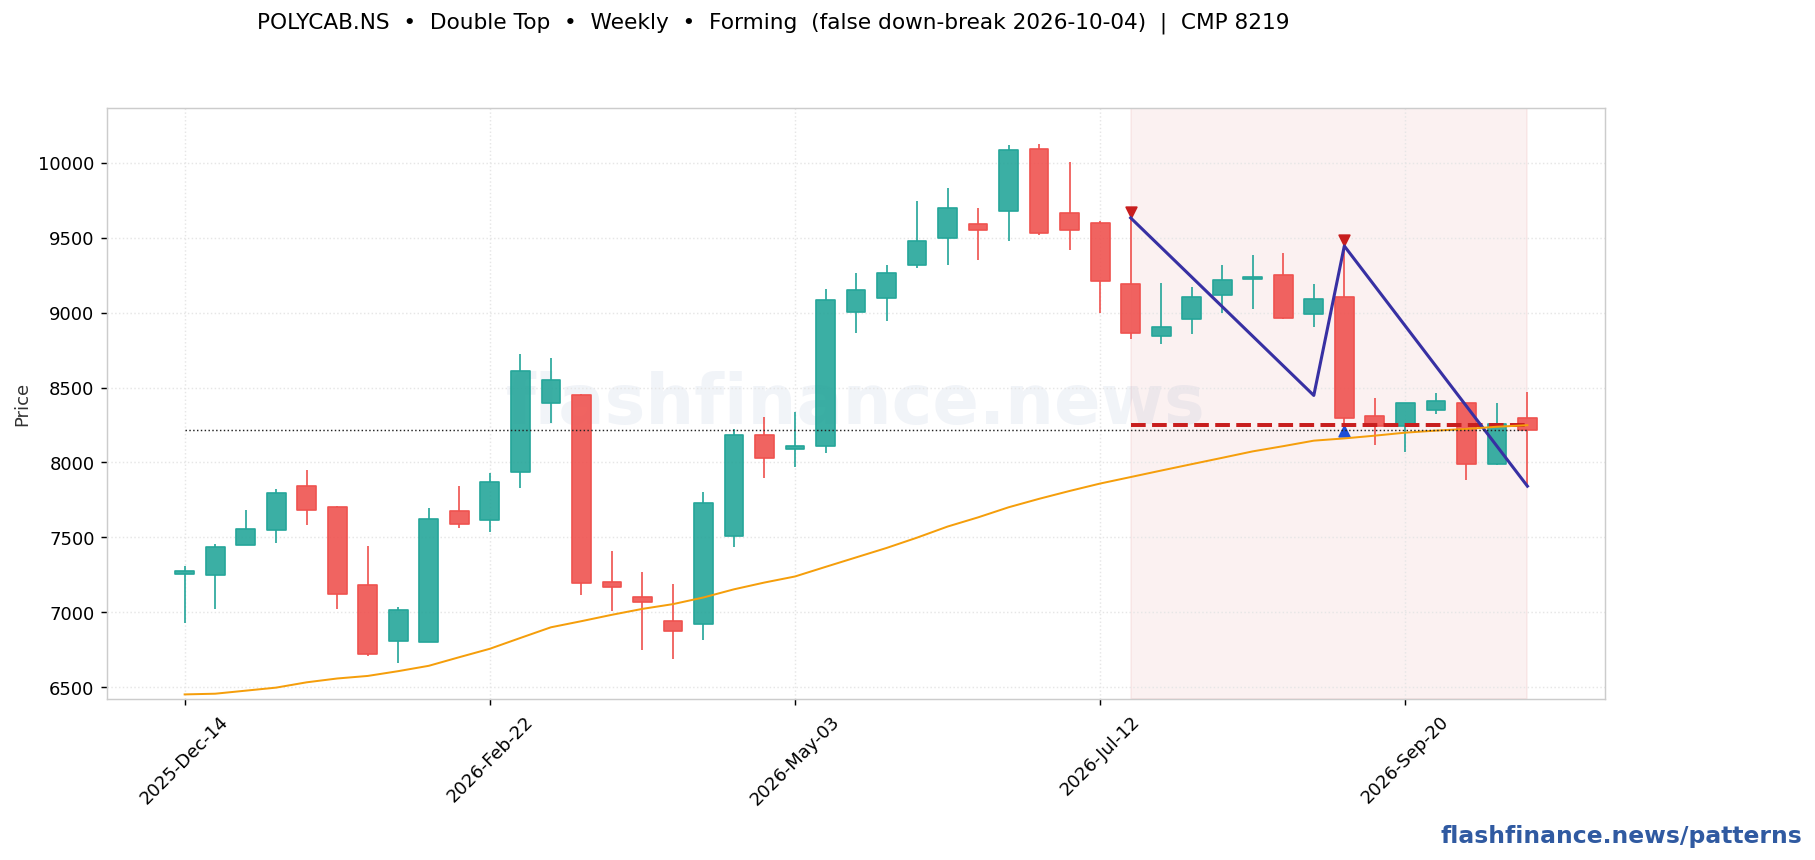
| POLYCABPolycab India Limited | Weekly | Bearish | ₹8,219.00 | ₹8,250.00 | 0.4% | ≈₹6,867.50 (-16%) | 3 |
| JSWSTEELJSW Steel Limited | Weekly | Bearish | ₹1,216.30 | ₹1,210.70 | 0.5% | ≈₹1,070.40 (-12%) | 3 |
| M&MMahindra & Mahindra Limited | Weekly | Bearish | ₹2,920.90 | ₹2,900.40 | 0.7% | ≈₹2,266.20 (-22%) | 3 |
| SWARAJENGSwaraj Engines Limited | Weekly | Bearish | ₹3,514.40 | ₹3,416.50 | 2.8% | ≈₹2,883.50 (-18%) | 3 |
| KAJARIACERKajaria Ceramics Limited | Weekly | Bearish | ₹1,211.00 | ₹1,158.40 | 4.3% | ≈₹1,041.80 (-14%) | 3 |
| CENTRALBKCentral Bank of India | Weekly | Bearish | ₹30.88 | ₹29.32 | 5.1% | ≈₹24.16 (-22%) | 3 |
| CASTROLINDCastrol India Limited | Weekly | Bearish | ₹197.74 | ₹170.10 | 14.0% | ≈₹136.80 (-31%) | 3 |
| LGBBROSLTDLG Balakrishnan & Bros Limited | Weekly | Bearish | ₹1,701.50 | ₹1,445.00 | 15.1% | ≈₹1,112.00 (-35%) | 3 |
Price makes a high, pulls back, rallies to almost exactly the same high and fails again. The low between the two peaks is the neckline.
Why it forms
The second failure tells everyone who bought the first peak that the price is not going through. Their exit is what breaks the neckline.
🎯 Trigger
📏 Target
🛑 Invalidation
POLYCAB — Weekly
What does a double top mean?
How far apart should the two tops be?
Is a double top reliable?
📚 Today's chart books (PDF)
About the chart books →Educational only. Prepared with AI assistance and reviewed by our editors; still check prices and levels yourself. Not investment advice.
How these are found: swing highs and lows are picked out with a percentage ZigZag on daily and weekly candles, and the boundaries are line-fitted through those swings. A formation is only published when the fit is tight, the boundaries are actually touched several times, and the price action stays inside them. The most recent swing is provisional, so a forming pattern can still change shape on the next candle, and patterns whose break already played out are dropped rather than shown as fresh. Levels and targets are the textbook measured moves, not forecasts. This is auto-generated market data, not investment advice.
