
Head and Shoulders Pattern
Three peaks with the middle one highest — the best known topping pattern there is.
Shows the chart pattern on any stock we chart, or tells you there isn't one today.
Showing 26 of 26. Trigger is the price a daily close must clear for the pattern to complete; Target is the measured move it projects, marked ≈ while the break has not happened yet.
| Stock | TF | State | CMP | Trigger | Away | Target | Touches |
|---|---|---|---|---|---|---|---|
| 3MINDIA3M India Limited | Weekly | ▼ Broken down | ₹30,400.00 | ₹31,198.18 | broken | ₹25,926.36 (-15%) | 5 |
| GMRAIRPORTGMR AIRPORTS LIMITED | Weekly | ▼ Broken down | ₹89.50 | ₹91.92 | broken | ₹68.45 (-24%) | 5 |
| GSFCGujarat State Fertilizers & Chemicals Limited | Weekly | ▼ Broken down | ₹148.86 | ₹154.72 | broken | ₹124.81 (-16%) | 5 |
| DIXONDixon Technologies (India) Limited | Weekly | ▼ Broken down | ₹12,340.00 | ₹12,700.33 | broken | ₹10,228.00 (-17%) | 5 |
| CHAMBLFERTChambal Fertilizers & Chemicals Limited | Weekly | ▼ Broken down | ₹388.10 | ₹428.82 | broken | ₹352.40 (-9%) | 5 |
| NBCCNBCC (India) Limited | Weekly | ▼ Broken down | ₹75.51 | ₹89.83 | broken | ₹65.37 (-13%) | 5 |
| INGERRANDIngersoll Rand (India) Limited | Weekly | Bearish | ₹4,053.60 | ₹4,067.00 | 0.3% | ≈₹3,281.00 (-19%) | 5 |
| SUPRAJITSuprajit Engineering Limited | Weekly | Bearish | ₹465.45 | ₹463.57 | 0.4% | ≈₹370.46 (-20%) | 5 |
| POWERINDIAHitachi Energy India Limited | Weekly | Bearish | ₹28,990.00 | ₹29,173.57 | 0.6% | ≈₹22,817.86 (-21%) | 5 |
| ENDURANCEEndurance Technologies Limited | Weekly | Bearish | ₹2,406.40 | ₹2,388.67 | 0.7% | ≈₹1,811.96 (-25%) | 5 |
| OFSSOracle Financial Services Software Limited | Weekly | Bearish | ₹10,386.00 | ₹10,463.67 | 0.7% | ≈₹8,124.00 (-22%) | 5 |
| REDTAPERedtape Limited | Daily | Bearish | ₹114.15 | ₹113.10 | 0.9% | ≈₹93.45 (-18%) | 5 |
| BHARATFORGBharat Forge Limited | Weekly | Bearish | ₹1,835.00 | ₹1,855.76 | 1.1% | ≈₹1,404.45 (-23%) | 5 |
| MAHABANKBank of Maharashtra | Weekly | Bearish | ₹79.79 | ₹78.11 | 2.1% | ≈₹60.36 (-24%) | 5 |
| LMWLMW Limited | Weekly | Bearish | ₹16,060.00 | ₹15,670.00 | 2.4% | ≈₹11,189.00 (-30%) | 5 |
| BIRETBrookfield India Real Estate Trust | Weekly | Bearish | ₹321.72 | ₹312.36 | 2.9% | ≈₹249.03 (-23%) | 5 |
| CHOICEINChoice International Limited | Weekly | Bearish | ₹740.55 | ₹718.49 | 3.0% | ≈₹589.68 (-20%) | 5 |
| BELRISEBelrise Industries Limited | Weekly | Bearish | ₹231.51 | ₹223.93 | 3.3% | ≈₹177.01 (-24%) | 5 |
| BALKRISINDBalkrishna Industries Limited | Weekly | Bearish | ₹2,052.80 | ₹1,982.10 | 3.4% | ≈₹1,406.20 (-32%) | 5 |
| LICILife Insurance Corporation Of India | Weekly | Bearish | ₹397.75 | ₹378.84 | 4.8% | ≈₹319.48 (-20%) | 5 |
| LLOYDSMELloyds Metals And Energy Limited | Weekly | Bearish | ₹1,851.70 | ₹1,761.29 | 4.9% | ≈₹1,351.93 (-27%) | 5 |
| ETERNALETERNAL LIMITED | Daily | Bearish | ₹325.30 | ₹306.08 | 5.9% | ≈₹271.36 (-17%) | 5 |
| 360ONE360 ONE WAM LIMITED | Weekly | Bearish | ₹1,075.00 | ₹999.91 | 7.0% | ≈₹809.29 (-25%) | 5 |
| EICHERMOTEicher Motors Limited | Daily | Bearish | ₹7,284.50 | ₹6,730.86 | 7.6% | ≈₹5,559.30 (-24%) | 5 |
| TVSMOTORTVS Motor Company Limited | Weekly | Bearish | ₹4,095.10 | ₹3,759.34 | 8.2% | ≈₹2,912.12 (-29%) | 5 |
| PNGJLP N Gadgil Jewellers Limited | Weekly | Bearish | ₹603.35 | ₹541.20 | 10.3% | ≈₹405.55 (-33%) | 5 |
A peak (left shoulder), a higher peak (head), then a lower peak roughly level with the first (right shoulder). The line joining the two troughs is the neckline, and it may slope.
Why it forms
The head is the last surge of buying. The right shoulder failing to reach it says that buying is gone. Breaking the neckline confirms the uptrend's structure of higher highs and higher lows is over.
🎯 Trigger
📏 Target
🛑 Invalidation
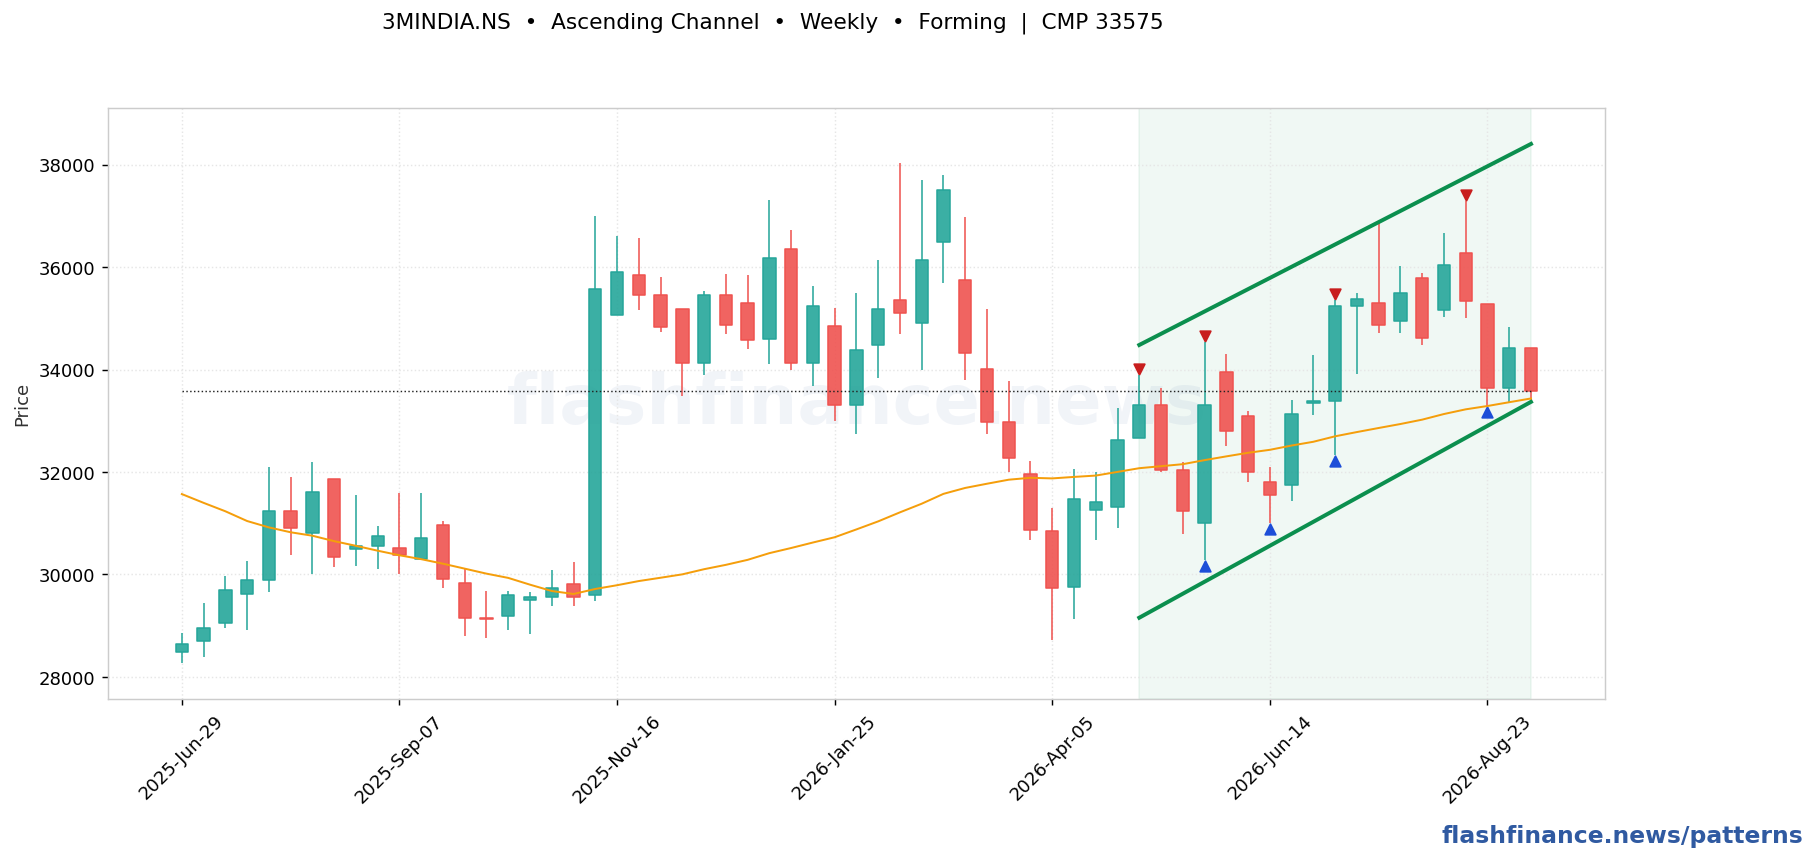
3MINDIA — Weekly
What does a head and shoulders pattern indicate?
Does the neckline have to be horizontal?
What is an inverse head and shoulders?
📚 Today's chart books (PDF)
About the chart books →Educational only. Prepared with AI assistance and reviewed by our editors; still check prices and levels yourself. Not investment advice.
How these are found: swing highs and lows are picked out with a percentage ZigZag on daily and weekly candles, and the boundaries are line-fitted through those swings. A formation is only published when the fit is tight, the boundaries are actually touched several times, and the price action stays inside them. The most recent swing is provisional, so a forming pattern can still change shape on the next candle, and patterns whose break already played out are dropped rather than shown as fresh. Levels and targets are the textbook measured moves, not forecasts. This is auto-generated market data, not investment advice.
