
Ascending Triangle Pattern
A flat ceiling with a rising floor — buyers paying up into the same resistance until it gives way.
Shows the chart pattern on any stock we chart, or tells you there isn't one today.
Showing 12 of 12. Trigger is the price a daily close must clear for the pattern to complete; Target is the measured move it projects, marked ≈ while the break has not happened yet.
| Stock | TF | State | CMP | Trigger | Away | Target | Touches |
|---|---|---|---|---|---|---|---|
| HCLTECHHCL Technologies Limited | Weekly | Bullish | ₹1,380.00 | ₹1,384.80 | 0.3% | ≈₹1,731.27 (+25%) | 4 |
| NYKAAFSN E-Commerce Ventures Limited | Weekly | Bullish | ₹345.00 | ₹349.55 | 1.3% | ≈₹441.30 (+28%) | 4 |
| PETRONETPetronet LNG Limited | Daily | Bullish | ₹293.00 | ₹299.33 | 2.2% | ≈₹327.39 (+12%) | 4 |
| HDFCBANKHDFC Bank Limited | Daily | Bullish | ₹728.85 | ₹745.69 | 2.3% | ≈₹827.86 (+14%) | 7 |
| VBLVarun Beverages Limited | Daily | Bullish | ₹430.50 | ₹444.23 | 3.2% | ≈₹507.74 (+18%) | 6 |
| SAGILITYSAGILITY LIMITED | Weekly | Bullish | ₹45.30 | ₹47.81 | 5.5% | ≈₹57.13 (+26%) | 7 |
| SHREMINVITShrem InvIT | Daily | Bullish | ₹102.00 | ₹108.07 | 5.9% | ≈₹120.10 (+18%) | 7 |
| JSWHLJSW Holdings Limited | Weekly | Bullish | ₹11,316.00 | ₹12,229.25 | 8.1% | ≈₹14,380.77 (+27%) | 6 |
| KPILKalpataru Projects International Limited | Weekly | Bullish | ₹1,364.30 | ₹1,490.69 | 9.3% | ≈₹1,756.03 (+29%) | 4 |
| NAVINFLUORNavin Fluorine International Limited | Weekly | Bullish | ₹8,167.00 | ₹8,949.50 | 9.6% | ≈₹11,211.12 (+37%) | 5 |
| ZYDUSLIFEZydus Lifesciences Limited | Weekly | Bullish | ₹1,123.00 | ₹1,232.10 | 9.7% | ≈₹1,553.09 (+38%) | 7 |
| RBLBANKRBL Bank Limited | Weekly | Bullish | ₹378.25 | ₹429.60 | 13.6% | ≈₹511.35 (+35%) | 5 |
Price keeps stalling at almost exactly the same high, but each pullback ends higher than the last. Drawing a horizontal line across the highs and a rising line under the lows gives a wedge that narrows to the right.
Why it forms
One block of supply sits at a fixed price. Buyers absorb it in waves and, because each wave starts from a higher low, they are willing to pay more each time. When the supply is finally used up, there is nothing above it.
🎯 Trigger
📏 Target
🛑 Invalidation
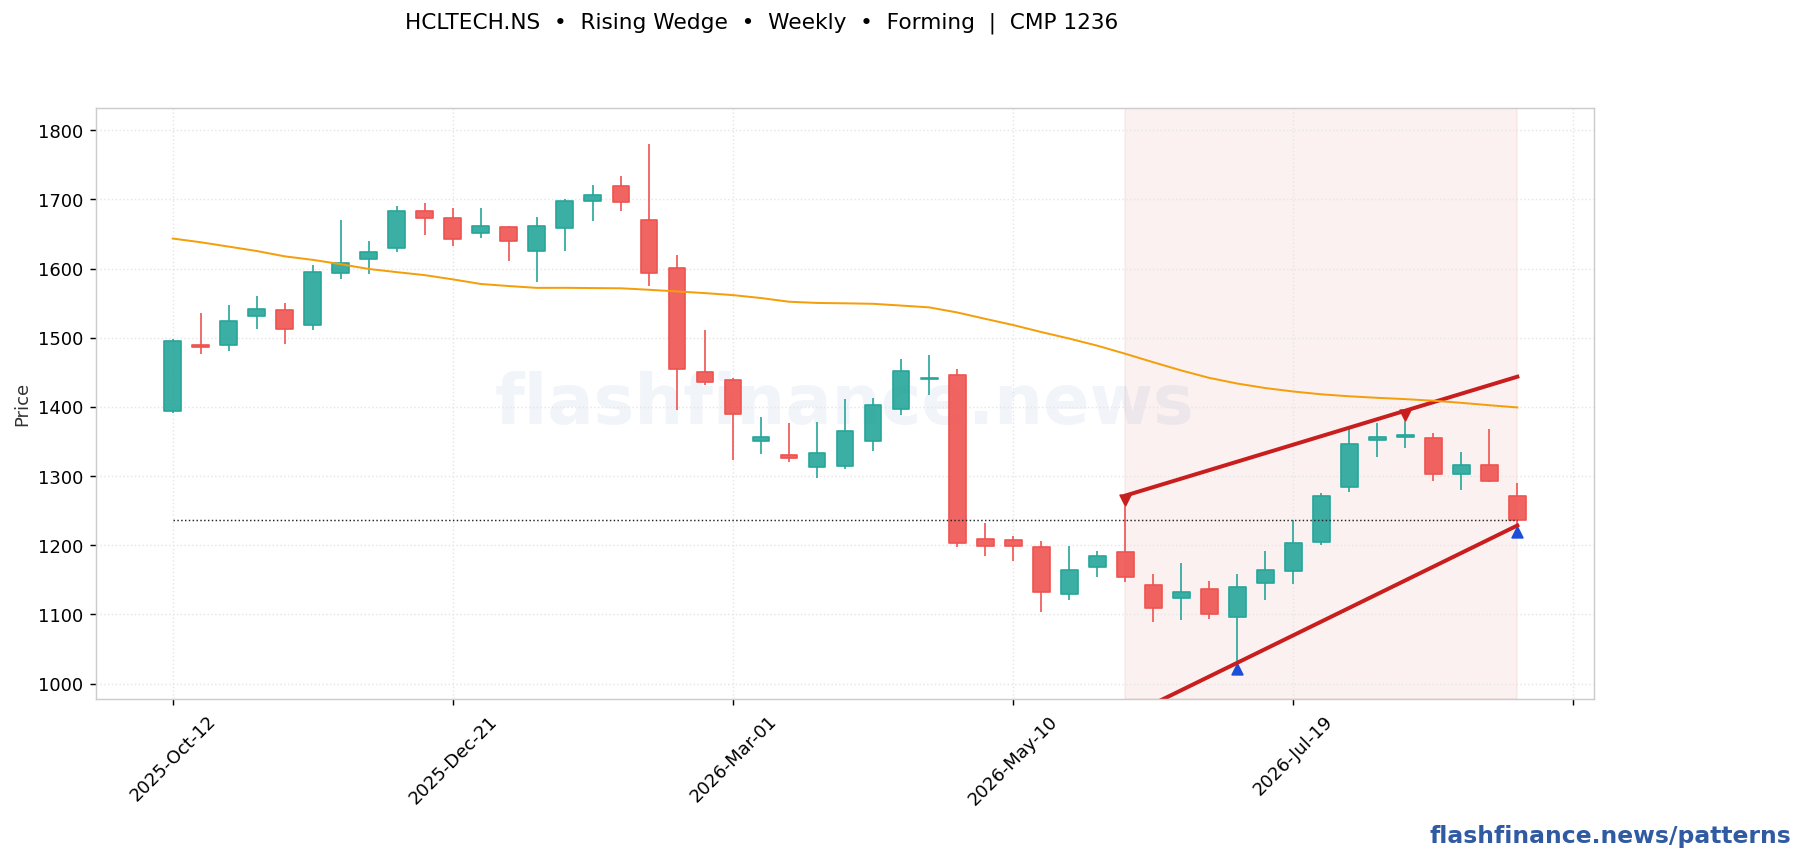
HCLTECH — Weekly
Is an ascending triangle bullish or bearish?
How long should an ascending triangle take to break out?
What confirms an ascending triangle breakout?
📚 Today's chart books (PDF)
About the chart books →Educational only. Prepared with AI assistance and reviewed by our editors; still check prices and levels yourself. Not investment advice.
How these are found: swing highs and lows are picked out with a percentage ZigZag on daily and weekly candles, and the boundaries are line-fitted through those swings. A formation is only published when the fit is tight, the boundaries are actually touched several times, and the price action stays inside them. The most recent swing is provisional, so a forming pattern can still change shape on the next candle, and patterns whose break already played out are dropped rather than shown as fresh. Levels and targets are the textbook measured moves, not forecasts. This is auto-generated market data, not investment advice.
