
Nifty 50 Trades 6.8% Below Five-Year Median as Smallcap Valuations Surge 11% Above Historical Levels
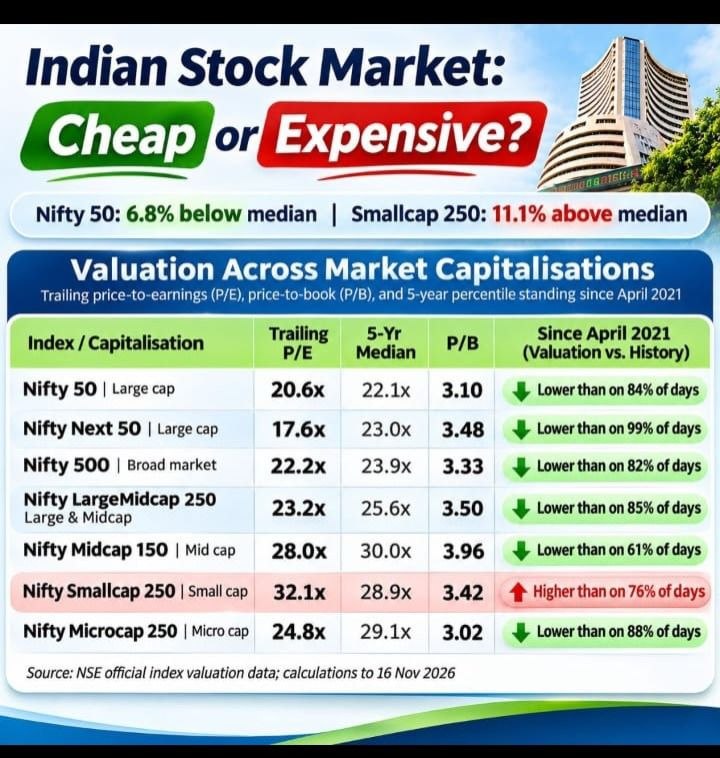
A comprehensive comparative analysis of official National Stock Exchange (NSE) valuation data has challenged the prevailing narrative that Indian equities are uniformly overvalued. Rather than a market-wide bubble, the latest trailing price-to-earnings (P/E) metrics reveal a sharp polarization across market capitalisations: large-cap stocks are trading well below their five-year historical averages, while small-cap equities continue to command stretched premiums.
According to index valuation data compiled to November 16, six of the seven primary NSE equity indices are trading below their median valuations observed over the past five years. The benchmark Nifty 50 index stands at a trailing P/E of 20.6x against its five-year median of 22.1x, placing it 6.8% below its historical normal. Historically, the headline index's valuation has been lower than this level on only 16% of trading days since April 2021, meaning it is cheaper than it was on 84% of trading days in that period. The index also trades at a price-to-book (P/B) ratio of 3.10.
Index-Wise Valuation Metrics Across Market Capitalisations:
- Nifty 50 (Large cap): Trailing P/E of 20.6x compared to a 5-year median of 22.1x; P/B of 3.10; valuation is lower than on 84% of days since April 2021.
- Nifty Next 50 (Large cap): Trailing P/E of 17.6x compared to a 5-year median of 23.0x; P/B of 3.48; valuation is lower than on 99% of days since April 2021.
- Nifty 500 (Broad market): Trailing P/E of 22.2x compared to a 5-year median of 23.9x; P/B of 3.33; valuation is lower than on 82% of days since April 2021.
- Nifty LargeMidcap 250: Trailing P/E of 23.2x compared to a 5-year median of 25.6x; P/B of 3.50; valuation is lower than on 85% of days since April 2021.
- Nifty Midcap 150: Trailing P/E of 28.0x compared to a 5-year median of 30.0x; P/B of 3.96; valuation is lower than on 61% of days since April 2021.
- Nifty Smallcap 250: Trailing P/E of 32.1x compared to a 5-year median of 28.9x; P/B of 3.42; valuation is higher than on 76% of days since April 2021.
- Nifty Microcap 250: Trailing P/E of 24.8x compared to a 5-year median of 29.1x; P/B of 3.02; valuation is lower than on 88% of days since April 2021.
Large Caps Present Significant Valuation Comfort
The most striking discount is observed in the Nifty Next 50 basket, which tracks businesses ranked 51st through 100th by market capitalisation. At a trailing P/E of 17.6x against a historical median of 23.0x, the index sits 23.5% below its five-year median. The current multiple represents the bottom 1% of valuation days since April 2021, indicating that earnings growth among these emerging blue chips has outpaced price momentum or that market sentiment has disproportionately discounted the basket.
Similarly, broad market gauges reflect moderation. The Nifty 500 is trading 7.1% below its five-year median, while the Nifty LargeMidcap 250 sits 9.4% below normal.
Small Caps Stand Out as an Expensive Outlier
In contrast to the broader market relaxation, the Nifty Smallcap 250 index remains notably elevated. It trades at a trailing P/E of 32.1x, which is 11.1% above its five-year median of 28.9x. This makes small caps the only market capitalisation tier operating above its historical median, having traded cheaper on 76% of trading sessions over the 4.5-year observation window. Furthermore, the small-cap multiple of 32.1x is the highest absolute P/E across all evaluated indices, surpassing mid-caps (28.0x), micro-caps (24.8x), and large-caps (20.6x).
Interestingly, the Nifty Microcap 250 index has not mirrored the small-cap run-up. Micro caps are trading at 24.8x trailing earnings—14.8% below their median of 29.1x, with valuations lower than on 88% of sessions since April 2021. This suggests that liquidity and retail momentum have clustered heavily in institutional small-cap names rather than filtering entirely down to the micro-cap tier.
Key Takeaways for Indian Investors
For mutual fund investors and retail market participants managing systematic investment plans (SIPs), the data illustrates an asymmetric risk-reward setup:
Strategic Allocation Implications:
- Rotation towards Blue Chips: Large caps offer a far more protective cushion against sudden global volatility, as their starting valuation multiples sit near cyclical lows.
- Heightened Scrutiny on Small Caps: With small caps trading at an 11.1% premium to their historical norm, individual stock picking and disciplined profit-taking become vital, as room for multiple expansion appears constrained.
- Broad Market Resilience: Because the Nifty 500 and mid-cap segments remain below their median valuations, systemic valuation risk across the Indian corporate landscape remains subdued despite intermittent market pullbacks.