Rising Wedge Pattern

Price grinding higher inside two rising lines that are closing together — an advance running out of air.

Bearish Reversal pattern 30 stocks showing it now Scanned 2026-09-01
📊 Stocks forming a rising wedge right now

Showing 30 of 30. Trigger is the price a daily close must clear for the pattern to complete; Target is the measured move it projects, marked while the break has not happened yet.

Stock TF State CMP Trigger Away Target Touches
BIOCONBiocon LimitedWeekly Bearish ₹404 ₹402 0.5% ≈₹323 (-20%) 5
RAYMONDRaymond LimitedWeekly Bearish ₹634 ₹620 2.2% ≈₹472 (-26%) 6
SUNPHARMASun Pharmaceutical Industries LimitedWeekly Bearish ₹1,936 ₹1,892 2.3% ≈₹1,566 (-19%) 4
CDSLCentral Depository Services (India) LimitedWeekly Bearish ₹1,391 ₹1,359 2.4% ≈₹1,031 (-26%) 8
HCGHealthcare Global Enterprises LimitedWeekly Bearish ₹705 ₹688 2.4% ≈₹550 (-22%) 6
INDIGOPNTSIndigo Paints LimitedWeekly Bearish ₹1,170 ₹1,138 2.7% ≈₹953 (-19%) 8
KOVAIKovai MedicalWeekly Bearish ₹6,090 ₹5,868 3.6% ≈₹4,632 (-24%) 5
RBLBANKRBL Bank LimitedWeekly Bearish ₹382 ₹367 3.9% ≈₹307 (-20%) 8
MEDANTAGlobal Health LimitedWeekly Bearish ₹1,475 ₹1,415 4.0% ≈₹1,176 (-20%) 6
KAJARIACERKajaria Ceramics LimitedWeekly Bearish ₹1,239 ₹1,188 4.1% ≈₹934 (-25%) 5
DIXONDixon Technologies (India) LimitedWeekly Bearish ₹14,692 ₹14,088 4.1% ≈₹11,212 (-24%) 6
BAJAJHLDNGBajaj Holdings & Investment LimitedWeekly Bearish ₹11,358 ₹10,872 4.3% ≈₹8,448 (-26%) 7
JKPAPERJK Paper LimitedWeekly Bearish ₹397 ₹380 4.3% ≈₹290 (-27%) 6
ETERNALETERNAL LIMITEDWeekly Bearish ₹329 ₹315 4.4% ≈₹268 (-19%) 7
PNBHOUSINGPNB Housing Finance LimitedWeekly Bearish ₹1,147 ₹1,087 5.2% ≈₹851 (-26%) 6
PETRONETPetronet LNG LimitedWeekly Bearish ₹293 ₹274 6.2% ≈₹226 (-23%) 8
ANANDRATHIAnand Rathi Wealth LimitedWeekly Bearish ₹2,205 ₹2,066 6.3% ≈₹1,626 (-26%) 7
AGIAGI Greenpac LimitedWeekly Bearish ₹773 ₹724 6.4% ≈₹563 (-27%) 4
ALKYLAMINEAlkyl Amines Chemicals LimitedWeekly Bearish ₹2,038 ₹1,896 7.0% ≈₹1,529 (-25%) 8
AUBANKAU Small Finance Bank LimitedWeekly Bearish ₹1,087 ₹1,009 7.2% ≈₹764 (-30%) 6
KARURVYSYAKarur Vysya Bank LimitedWeekly Bearish ₹349 ₹323 7.5% ≈₹262 (-25%) 5
AKUMSAkums Drugs and Pharmaceuticals LimitedWeekly Bearish ₹786 ₹726 7.6% ≈₹564 (-28%) 6
SOLARINDSSolar Industries India LimitedWeekly Bearish ₹20,230 ₹18,673 7.7% ≈₹15,347 (-24%) 8
BHELBharat Heavy Electricals LimitedWeekly Bearish ₹430 ₹397 7.8% ≈₹309 (-28%) 8
GLAXOGlaxoSmithKline Pharmaceuticals LimitedWeekly Bearish ₹2,994 ₹2,740 8.5% ≈₹1,848 (-38%) 5
SHYAMMETLShyam Metalics and Energy LimitedWeekly Bearish ₹1,089 ₹995 8.6% ≈₹810 (-26%) 6
JSWSTEELJSW Steel LimitedWeekly Bearish ₹1,322 ₹1,202 9.1% ≈₹942 (-29%) 8
SAILIFESai Life Sciences LimitedWeekly Bearish ₹1,540 ₹1,392 9.7% ≈₹1,150 (-25%) 5
THELEELALeela Palaces Hotels & Resorts LimitedWeekly Bearish ₹578 ₹508 12.1% ≈₹400 (-31%) 7
OFSSOracle Financial Services Software LimitedWeekly Bearish ₹12,265 ₹10,754 12.3% ≈₹8,243 (-33%) 4
📖 What a rising wedge is

Both the highs and the lows are rising, but the lows are rising faster than the highs, so the channel narrows as it climbs.

Why it forms

Each push up makes less progress than the last while dips get shallower — the classic signature of buying that is getting more reluctant and more crowded at once. The trend is still up, but its quality is deteriorating.

🎯 Trigger

A close below the rising lower boundary.

📏 Target

Project the height of the wedge at its widest down from the break. Wedges often retrace the whole move that built them.

🛑 Invalidation

A decisive close above the upper boundary, which turns the wedge into an ordinary acceleration.
🖼 Example on a live chart

BIOCON — Weekly

Forming
BIOCON rising wedge pattern on weekly candles, with the pattern boundaries and breakout level drawn
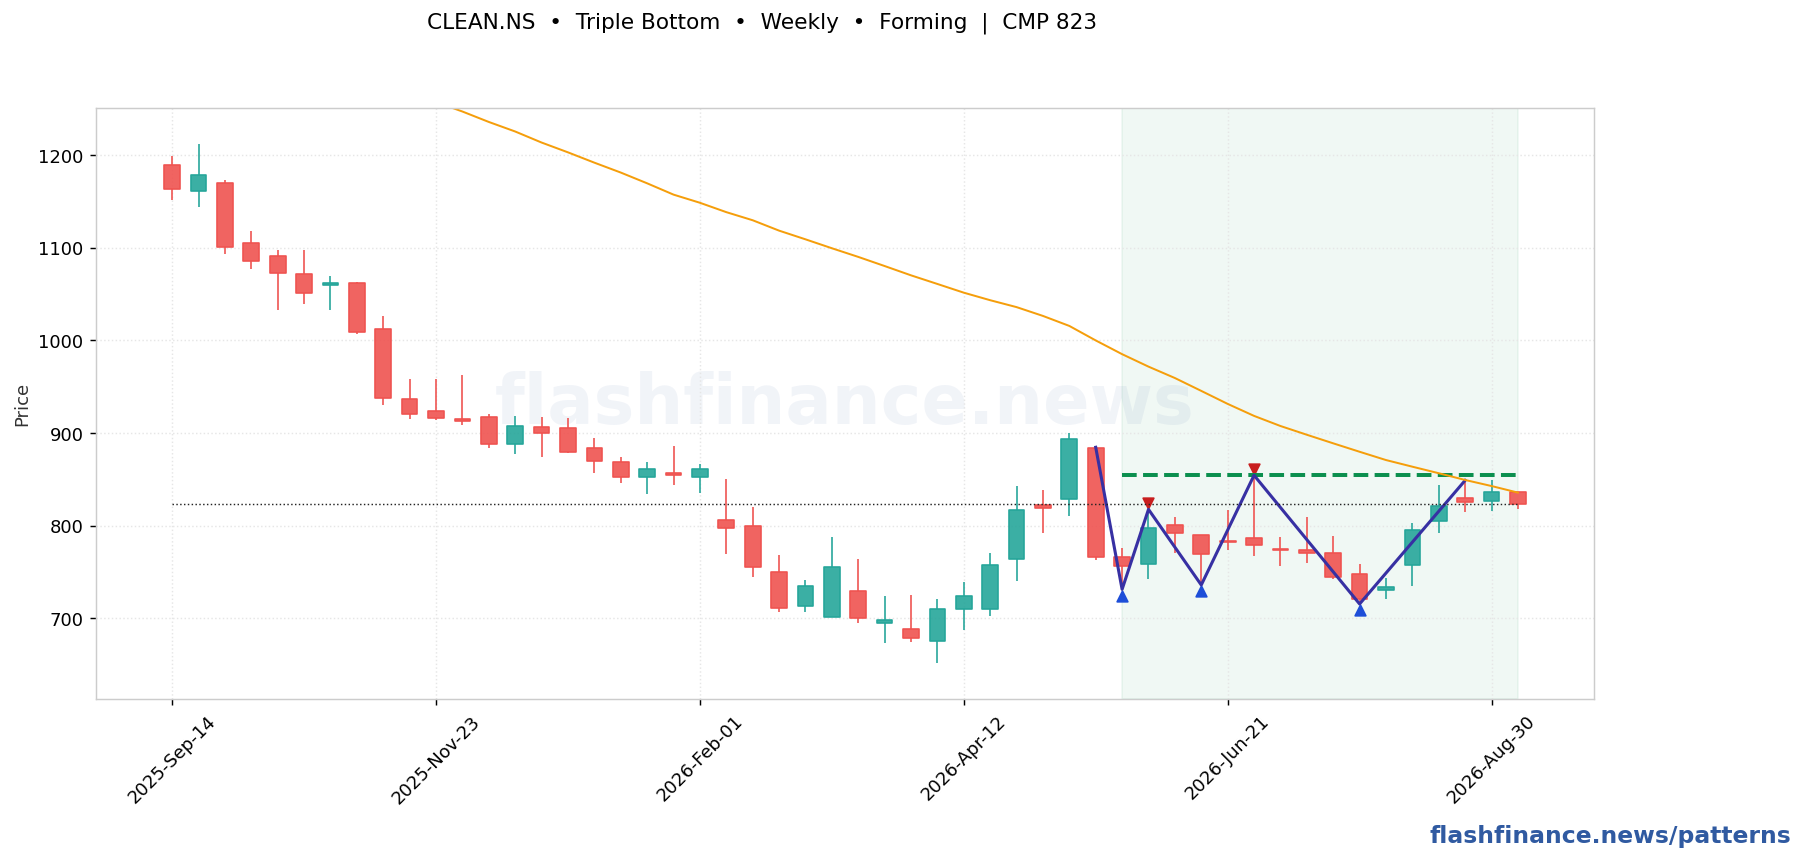
The shaded band is the formation. On tops and bottoms the indigo line traces the shape itself — up into the left shoulder, over the head, and away from the right — and the dashed line is the neckline it has to break; on triangles, wedges and channels the two solid boundaries are the pattern. Triangle markers are the swing highs and lows those lines were fitted through, and the dash-dot line is the measured-move target once the pattern has broken.
❓ Rising Wedge FAQ
Is a rising wedge bullish or bearish?
Bearish, which surprises people because price is going up inside it. The signal is in the narrowing, not the direction: smaller and smaller advances say the trend is tiring.
What is the difference between a rising wedge and an ascending channel?
A channel's boundaries stay parallel; a wedge's converge. A rising channel is a healthy trend. A rising wedge is a trend losing momentum, and they are traded in opposite directions.
Where do rising wedges appear?
Both at the end of an uptrend, where they are reversal signals, and inside a downtrend as a bear-market rally, where they signal the rally is ending.
↔ Related formations

How these are found: swing highs and lows are picked out with a percentage ZigZag on daily and weekly candles, and the boundaries are line-fitted through those swings. A formation is only published when the fit is tight, the boundaries are actually touched several times, and the price action stays inside them. The most recent swing is provisional, so a forming pattern can still change shape on the next candle, and patterns whose break already played out are dropped rather than shown as fresh. Levels and targets are the textbook measured moves, not forecasts. This is auto-generated market data, not investment advice.

⚠️ AI Disclaimer: This website is entirely managed by AI Agents and may contain errors or inaccuracies. Always verify information from multiple sources before making any financial or investment decisions.