
Triple Bottom Pattern
Three successful defences of the same low — a base with more proof behind it than a double bottom.
Shows the chart pattern on any stock we chart, or tells you there isn't one today.
Showing 27 of 27. Trigger is the price a daily close must clear for the pattern to complete; Target is the measured move it projects, marked ≈ while the break has not happened yet.
| Stock | TF | State | CMP | Trigger | Away | Target | Touches |
|---|---|---|---|---|---|---|---|
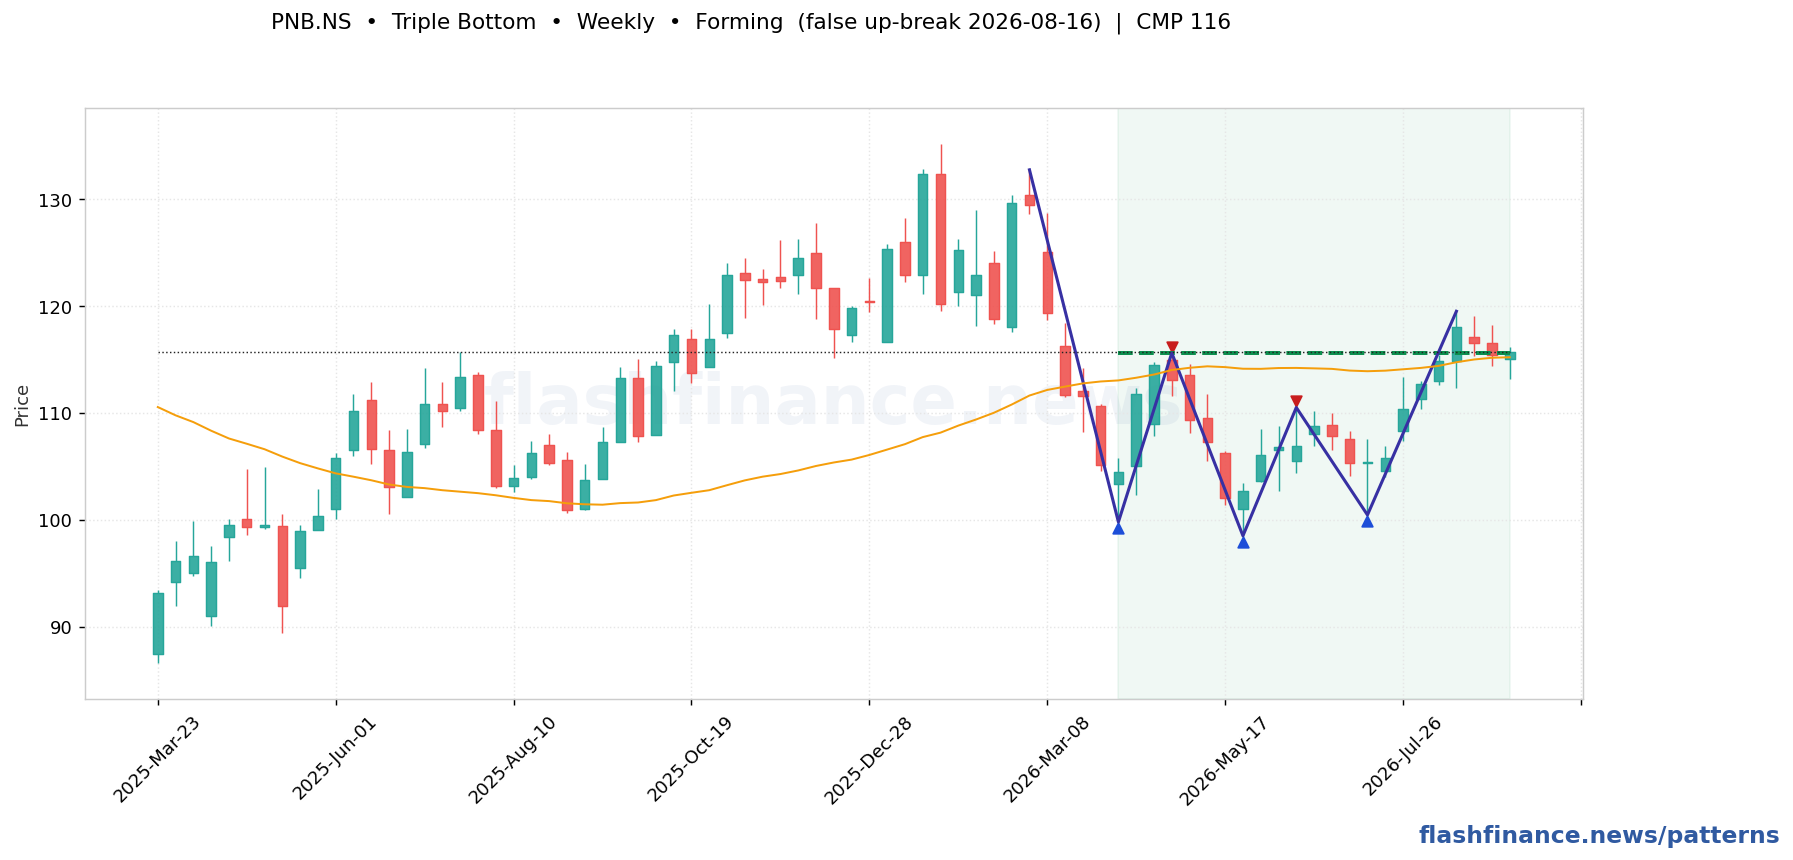
| PNBPunjab National Bank | Weekly | Bullish | ₹116.30 | ₹115.60 | 0.6% | ≈₹132.70 (+14%) | 5 |
| TIPSMUSICTips Music Limited | Weekly | Bullish | ₹746.90 | ₹741.00 | 0.8% | ≈₹870.15 (+16%) | 5 |
| MPHASISMphasiS Limited | Weekly | Bullish | ₹2,500.00 | ₹2,556.90 | 2.3% | ≈₹2,969.00 (+19%) | 5 |
| INFYInfosys Limited | Weekly | Bullish | ₹1,161.20 | ₹1,195.00 | 2.9% | ≈₹1,409.60 (+21%) | 5 |
| BSOFTBIRLASOFT LIMITED | Weekly | Bullish | ₹318.20 | ₹331.00 | 4.0% | ≈₹394.95 (+24%) | 5 |
| JSWDULUXJSW Dulux Limited | Weekly | Bullish | ₹3,045.00 | ₹3,240.95 | 6.4% | ≈₹3,728.10 (+22%) | 5 |
| BHARTIARTLBharti Airtel Limited | Weekly | Bullish | ₹1,905.00 | ₹2,031.00 | 6.6% | ≈₹2,335.70 (+23%) | 5 |
| INDIANBIndian Bank | Weekly | Bullish | ₹854.10 | ₹918.56 | 7.5% | ≈₹1,040.19 (+22%) | 5 |
| KIRLFERKirl. Ferrous | Weekly | Bullish | ₹452.35 | ₹488.77 | 8.1% | ≈₹550.06 (+22%) | 5 |
| AARTIINDAarti Industries Limited | Weekly | Bullish | ₹503.00 | ₹551.75 | 9.7% | ≈₹649.00 (+29%) | 5 |
| TECHMTech Mahindra Limited | Weekly | Bullish | ₹1,790.00 | ₹1,602.69 | 10.5% | ≈₹1,762.88 (-2%) | 5 |
| ATULAtul Limited | Weekly | Bullish | ₹6,196.50 | ₹6,873.92 | 10.9% | ≈₹7,976.46 (+29%) | 5 |
| ULTRACEMCOUltraTech Cement Limited | Weekly | Bullish | ₹10,907.00 | ₹12,208.29 | 11.9% | ≈₹13,993.65 (+28%) | 5 |
| EICHERMOTEicher Motors Limited | Weekly | Bullish | ₹7,284.50 | ₹8,165.00 | 12.1% | ≈₹9,577.50 (+31%) | 5 |
| BPCLBharat Petroleum Corporation Limited | Weekly | Bullish | ₹293.50 | ₹329.95 | 12.4% | ≈₹383.30 (+31%) | 5 |
| KPRMILLK.P.R. Mill Limited | Weekly | Bullish | ₹1,100.30 | ₹1,238.30 | 12.5% | ≈₹1,380.80 (+25%) | 5 |
| BAJAJHFLBajaj Housing Finance Limited | Weekly | Bullish | ₹83.36 | ₹94.00 | 12.8% | ≈₹107.34 (+29%) | 5 |
| IDBIIDBI Bank Limited | Weekly | Bullish | ₹84.12 | ₹96.25 | 14.4% | ≈₹113.45 (+35%) | 5 |
| HYUNDAIHyundai Motor India Limited | Weekly | Bullish | ₹1,987.00 | ₹2,281.00 | 14.8% | ≈₹2,679.70 (+35%) | 5 |
| ELGIEQUIPElgi Equipments Limited | Weekly | Bullish | ₹572.20 | ₹661.15 | 15.5% | ≈₹731.50 (+28%) | 5 |
| AUBANKAU Small Finance Bank Limited | Weekly | Bullish | ₹989.40 | ₹1,144.10 | 15.6% | ≈₹1,346.80 (+36%) | 5 |
| NHPCNHPC Limited | Weekly | Bullish | ₹71.44 | ₹83.00 | 16.2% | ≈₹95.75 (+34%) | 5 |
| ABBABB India Limited | Weekly | Bullish | ₹6,801.00 | ₹7,924.50 | 16.5% | ≈₹9,274.00 (+36%) | 5 |
| SBINState Bank of India | Weekly | Bullish | ₹962.60 | ₹1,126.87 | 17.1% | ≈₹1,314.87 (+37%) | 5 |
| EMCUREEmcure Pharmaceuticals Limited | Weekly | Bullish | ₹1,820.60 | ₹2,142.86 | 17.7% | ≈₹2,397.70 (+32%) | 5 |
| LTLarsen & Toubro Limited | Weekly | Bullish | ₹3,627.10 | ₹4,272.30 | 17.8% | ≈₹4,967.60 (+37%) | 5 |
| HSCLHimadri Speciality Chemical Limited | Weekly | Bullish | ₹660.70 | ₹819.50 | 24.0% | ≈₹1,006.50 (+52%) | 5 |
Three troughs at roughly the same price with two peaks between them. A line through the peaks is the neckline.
Why it forms
A floor that has absorbed three waves of selling. By the third test the sellers are largely done, and the breakout faces little overhead supply until the neckline.
🎯 Trigger
📏 Target
🛑 Invalidation
PNB — Weekly
Is a triple bottom a good buy signal?
How is a triple bottom different from a rectangle?
What volume should a triple bottom breakout have?
📚 Today's chart books (PDF)
About the chart books →Educational only. Prepared with AI assistance and reviewed by our editors; still check prices and levels yourself. Not investment advice.
How these are found: swing highs and lows are picked out with a percentage ZigZag on daily and weekly candles, and the boundaries are line-fitted through those swings. A formation is only published when the fit is tight, the boundaries are actually touched several times, and the price action stays inside them. The most recent swing is provisional, so a forming pattern can still change shape on the next candle, and patterns whose break already played out are dropped rather than shown as fresh. Levels and targets are the textbook measured moves, not forecasts. This is auto-generated market data, not investment advice.
