E-Rickshaw Sales September 2026: 35,922 Units, YC Electric Tops a Fragmented Market
Every e-rickshaw registered in India in September 2026, brand by brand: volumes, market share inside the segment, month-on-month and year-on-year change, and who gained or lost share.
How September went
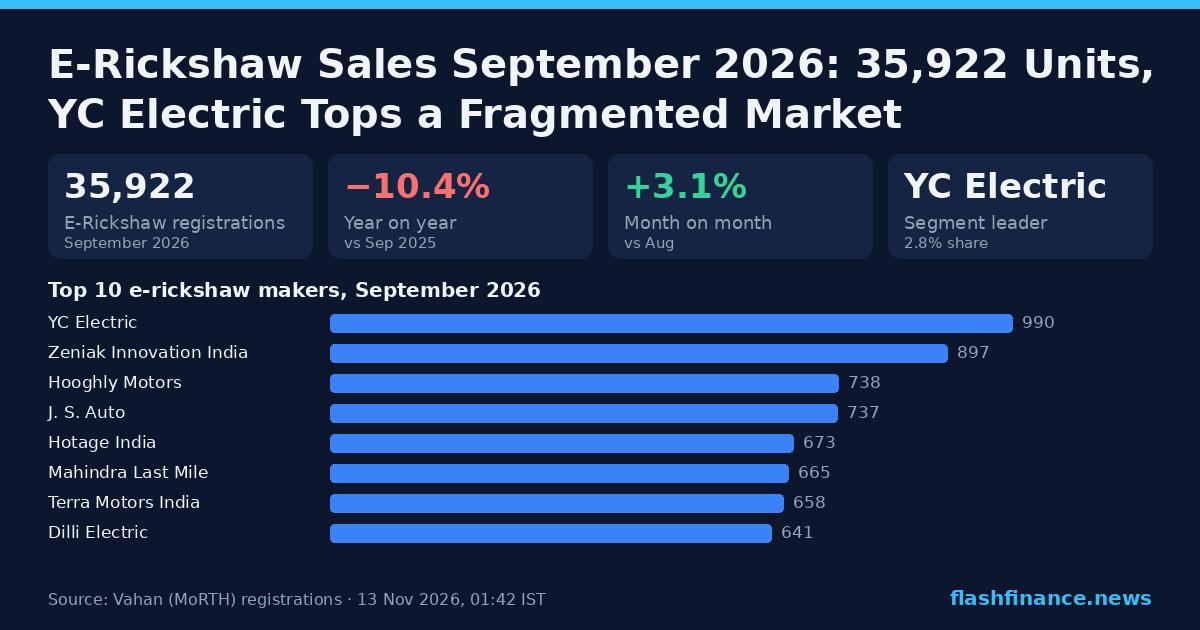
India registered 35,922 e-rickshaws in September 2026, −10.4% on September 2025 and +3.1% on August.
Across the 9 completed months of 2026 to September, 3,55,920 e-rickshaws have been registered, −9.7% on the same months of 2025.
Monthly e-rickshaw registrations, 2023–2026
One line per calendar year. The dashed end of the current year is the month so far.
E-Rickshaw market share, September 2026
YC Electric led the month with 990 registrations — 2.8% of the e-rickshaw market — ahead of Zeniak Innovation India on 897 (2.5%), a gap of 93 units. YC Electric also led August.
Hooghly Motors has gained the most share against September 2025, +1.01pp to 2.1%; YC Electric has lost the most, −5.21pp to 2.8%.
The top three hold 7.3% of the segment; 525 manufacturers registered at least one e-rickshaw.
Top 10 e-rickshaw makers, September 2026
E-rickshaw registrations only — every other vehicle type these companies make is excluded.
Share is of every e-rickshaw registered in the month. MoM and YoY compare each maker's own volume; the last column is its change in share of the segment.
| # | Manufacturer | Sep 2026 | Share | MoM | YoY | Share vs Sep 2025 |
|---|---|---|---|---|---|---|
| 1 | YC Electric | 990 | 2.8% | −2.4% | −69.0% | −5.21pp |
| 2 | Zeniak Innovation India | 897 | 2.5% | +21.1% | +6.3% | +0.39pp |
| 3 | Hooghly Motors | 738 | 2.1% | +1.2% | +76.6% | +1.01pp |
| 4 | J. S. Auto | 737 | 2.1% | +0.7% | −8.1% | +0.05pp |
| 5 | Hotage India | 673 | 1.9% | +5.2% | −6.8% | +0.07pp |
| 6 | Mahindra Last Mile | 665 | 1.9% | +33.0% | +14.7% | +0.40pp |
| 7 | Terra Motors India | 658 | 1.8% | −6.7% | −3.5% | +0.13pp |
| 8 | Dilli Electric | 641 | 1.8% | −13.0% | −53.0% | −1.62pp |
| 9 | Arrow Automotive | 590 | 1.6% | +16.8% | +107.0% | +0.93pp |
| 10 | Aahana Commerce | 580 | 1.6% | −0.3% | −13.9% | −0.07pp |
| 11 | Fede Industries | 558 | 1.6% | +56.7% | +50.0% | +0.63pp |
| 12 | Energy Electric Vehicles | 557 | 1.6% | −16.4% | −35.7% | −0.61pp |
| 13 | Move Stone Services | 554 | 1.5% | −3.8% | +25.1% | +0.44pp |
| 14 | Jajodia Commodities | 552 | 1.5% | +33.3% | +62.8% | +0.69pp |
| 15 | Saera Electric | 542 | 1.5% | +3.0% | −62.5% | −2.10pp |
| All others (510 makers) | 25,990 | 72.4% |
Exact: Vahan's maker x month table filtered to battery-electric fuels (PURE EV, ELECTRIC(BOV)) and the segment's vehicle classes — not a company total multiplied by anything.
Who is gaining
Monthly share of the e-rickshaw market for the six largest makers this month, over the last 15 completed months.
E-Rickshaw market share by month
Share of the segment each month, in per cent.
Market share, 2026 to September
The same table over 2026 to September, set against the same months of 2025.
| # | Manufacturer | Units | Share | vs 2025 | Volume YoY |
|---|---|---|---|---|---|
| 1 | YC Electric | 11,954 | 3.36% | −4.57pp | −61.7% |
| 2 | Zeniak Innovation India | 10,573 | 2.97% | +1.19pp | +50.9% |
| 3 | Dilli Electric | 8,839 | 2.48% | −1.29pp | −40.5% |
| 4 | Hooghly Motors | 8,598 | 2.42% | +1.51pp | +140.2% |
| 5 | J. S. Auto | 8,442 | 2.37% | +0.26pp | +1.6% |
| 6 | Aahana Commerce | 7,528 | 2.12% | +0.98pp | +68.1% |
| 7 | Energy Electric Vehicles | 6,916 | 1.94% | −0.46pp | −27.0% |
| 8 | Saera Electric | 6,874 | 1.93% | −2.63pp | −61.8% |
| 9 | Terra Motors India | 6,389 | 1.80% | +0.09pp | −4.9% |
| 10 | Hotage India | 5,865 | 1.65% | −0.16pp | −17.6% |
| 11 | Fede Industries | 5,736 | 1.61% | +1.04pp | +155.8% |
| 12 | Move Stone Services | 5,424 | 1.52% | +0.74pp | +75.0% |
| 13 | Sks Trade India | 5,256 | 1.48% | −0.37pp | −27.9% |
| 14 | Jajodia Commodities | 5,016 | 1.41% | +0.84pp | +123.1% |
| 15 | Mini Metro EV | 4,549 | 1.28% | −1.09pp | −51.2% |
Frequently asked questions
How many e-rickshaws were sold in India in September 2026?
Which company sold the most e-rickshaws in September 2026?
What is the e-rickshaw market share of each brand?
How are these numbers measured?
E-Rickshaw sales, earlier months
More from the reports desk
Source. Every figure is a vehicle registration, taken from the Ministry of Road Transport & Highways' Vahan 4 dashboard (vahan.parivahan.gov.in) — the same source FADA and the industry use for retail data. Registrations are not the wholesale dispatch numbers manufacturers announce each month. "EV" means battery electric (Vahan fuels PURE EV and ELECTRIC(BOV)); hybrids are counted separately. Information only, not investment advice.
Using these numbers? Cite "Flash Finance (Vahan data)" with a link to this page. This report's chart card is free to republish with the same credit.