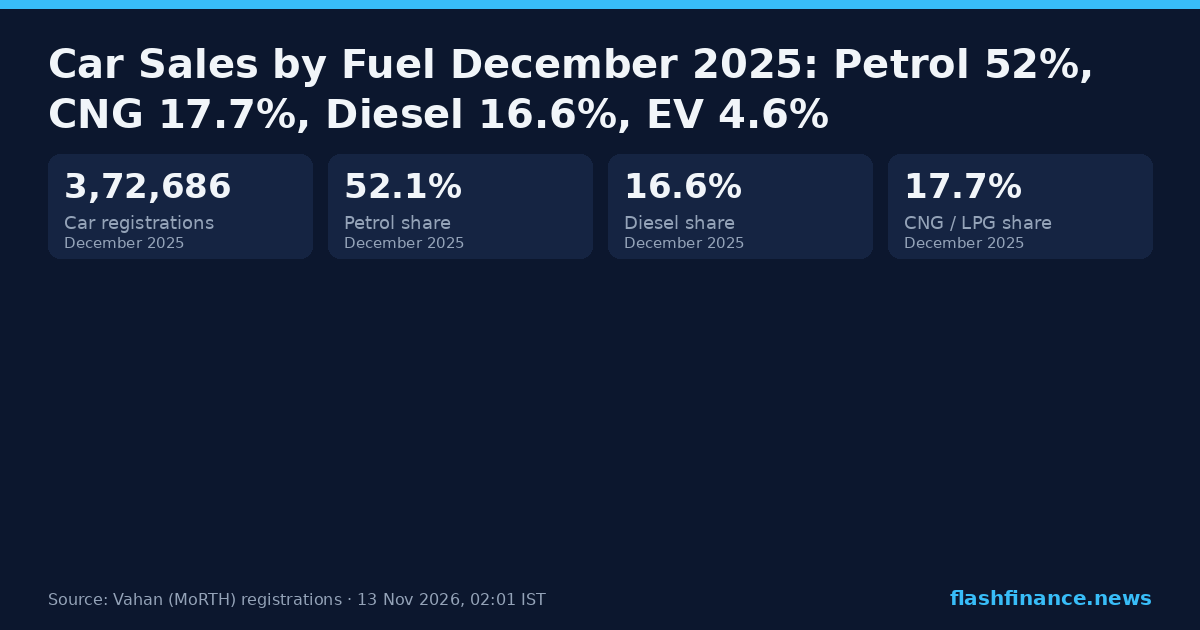
Car Sales by Fuel December 2025: Petrol 52%, CNG 17.7%, Diesel 16.6%, EV 4.6%
Every car registered in India in December 2025, split by fuel — petrol, diesel, CNG, hybrid and electric — and which carmakers sell each one.
The fuel mix, December 2025
India registered 3,72,686 cars in December 2025. By fuel: petrol 52.1%, CNG and LPG 17.7%, diesel 16.6%, hybrid 8.9%, battery-electric 4.6%.
Against December 2024, CNG and LPG gained the most share (+2.6pp) and petrol lost the most (−3.3pp).
Car fuel mix, December 2025
Share of car registrations by fuel.
| Fuel | Units | Share | vs Dec 2024 | YoY |
|---|---|---|---|---|
| Petrol | 1,94,279 | 52.1% | −3.31pp | +20.8% |
| CNG / LPG | 65,939 | 17.7% | +2.56pp | +50.2% |
| Diesel | 62,045 | 16.6% | −0.49pp | +24.8% |
| Hybrid | 33,041 | 8.9% | −0.18pp | +26.0% |
| Electric | 17,277 | 4.6% | +1.40pp | +84.3% |
| Other | 105 | 0.0% | +0.02pp | +950.0% |
Privately registered cars and UVs (Vahan class MOTOR CAR). Fuel buckets group Vahan's labels: PETROL and PETROL(E20) are petrol; every */HYBRID label and STRONG HYBRID EV is hybrid; battery-electric is PURE EV and ELECTRIC(BOV).
How the mix is moving
Each fuel's share of car registrations, month by month.
Car fuel mix by month
Per cent of car registrations.
Who sells CNG and LPG cars
Maruti Suzuki accounts for 65.1% of the 7,48,012 CNG and LPG cars registered in full-year 2025. Tata Motors (PV) is second on 22.3%.
| # | Manufacturer | Units | Share | vs full-year 2024 |
|---|---|---|---|---|
| 1 | Maruti Suzuki | 4,87,298 | 65.1% | −1.03pp |
| 2 | Tata Motors (PV) | 1,66,532 | 22.3% | +1.65pp |
| 3 | Hyundai | 60,017 | 8.0% | −1.75pp |
| 4 | Toyota Kirloskar | 23,801 | 3.2% | +0.88pp |
| 5 | Honda Cars | 3,892 | 0.5% | +0.02pp |
| 6 | Renault India | 2,478 | 0.3% | +0.18pp |
| 7 | Kia India | 1,931 | 0.3% | −0.02pp |
| 8 | Nissan India | 1,330 | 0.2% | +0.08pp |
| 9 | Tata Motors | 317 | 0.0% | +0.01pp |
| 10 | Stellantis Automobiles India | 221 | 0.0% | +0.02pp |
Our Vahan data holds maker by fuel for the year, not the month, so this table is full-year 2025.
Who sells diesel cars
Mahindra accounts for 55.8% of the 7,85,767 diesel cars registered in full-year 2025. Hyundai is second on 14.6%.
| # | Manufacturer | Units | Share | vs full-year 2024 |
|---|---|---|---|---|
| 1 | Mahindra | 4,38,763 | 55.8% | +3.16pp |
| 2 | Hyundai | 1,14,638 | 14.6% | +0.48pp |
| 3 | Kia India | 86,810 | 11.0% | +0.02pp |
| 4 | Tata Motors (PV) | 69,122 | 8.8% | −1.99pp |
| 5 | Toyota Kirloskar | 61,251 | 7.8% | −0.40pp |
| 6 | BMW India | 3,440 | 0.4% | −0.21pp |
| 7 | Stellantis India | 3,411 | 0.4% | −0.19pp |
| 8 | MG Motor | 2,773 | 0.4% | −0.50pp |
| 9 | Jaguar Land Rover India | 1,964 | 0.2% | +0.01pp |
| 10 | Mercedes-Benz | 1,529 | 0.2% | −0.31pp |
Our Vahan data holds maker by fuel for the year, not the month, so this table is full-year 2025.
Who sells hybrid cars
Maruti Suzuki accounts for 58.8% of the 3,56,651 hybrid cars registered in full-year 2025. Toyota Kirloskar is second on 36.6%.
| # | Manufacturer | Units | Share | vs full-year 2024 |
|---|---|---|---|---|
| 1 | Maruti Suzuki | 2,09,660 | 58.8% | −6.33pp |
| 2 | Toyota Kirloskar | 1,30,414 | 36.6% | +5.85pp |
| 3 | Mercedes-Benz | 14,286 | 4.0% | +0.72pp |
| 4 | Honda Cars | 1,009 | 0.3% | −0.11pp |
| 5 | Jaguar Land Rover India | 469 | 0.1% | −0.05pp |
| 6 | Skoda | 357 | 0.1% | −0.03pp |
| 7 | BMW India | 192 | 0.1% | −0.05pp |
| 8 | Audi Ag | 149 | 0.0% | −0.02pp |
| 9 | Porsche Ag Germany | 38 | 0.0% | +0.01pp |
| 10 | Automobili Lamborghini S.P.A | 29 | 0.0% | +0.01pp |
Our Vahan data holds maker by fuel for the year, not the month, so this table is full-year 2025.
Who sells battery-electric cars
Tata Motors (EV) accounts for 38.2% of the 1,87,764 battery-electric cars registered in full-year 2025. MG Motor is second on 29.9%.
| # | Manufacturer | Units | Share | vs full-year 2024 |
|---|---|---|---|---|
| 1 | Tata Motors (EV) | 71,695 | 38.2% | −22.20pp |
| 2 | MG Motor | 56,116 | 29.9% | +6.43pp |
| 3 | Mahindra Electric Automobile | 30,420 | 16.2% | +16.20pp |
| 4 | Hyundai | 7,344 | 3.9% | +2.91pp |
| 5 | Byd India | 5,143 | 2.7% | −0.11pp |
| 6 | BMW India | 3,472 | 1.8% | +0.51pp |
| 7 | Mahindra | 3,308 | 1.8% | −5.61pp |
| 8 | Kia India | 2,921 | 1.6% | +1.10pp |
| 9 | Mahindra Electric Mobility | 2,810 | 1.5% | +1.50pp |
| 10 | Mercedes-Benz | 1,454 | 0.8% | −0.28pp |
Our Vahan data holds maker by fuel for the year, not the month, so this table is full-year 2025.
Who sells petrol cars
Maruti Suzuki accounts for 41.4% of the 21,91,462 petrol cars registered in full-year 2025. Hyundai is second on 16.7%.
| # | Manufacturer | Units | Share | vs full-year 2024 |
|---|---|---|---|---|
| 1 | Maruti Suzuki | 9,07,102 | 41.4% | +1.12pp |
| 2 | Hyundai | 3,65,366 | 16.7% | −2.03pp |
| 3 | Tata Motors (PV) | 2,74,703 | 12.5% | −1.00pp |
| 4 | Kia India | 1,75,831 | 8.0% | +0.47pp |
| 5 | Skoda | 1,14,302 | 5.2% | +1.32pp |
| 6 | Mahindra | 1,11,757 | 5.1% | +0.72pp |
| 7 | Toyota Kirloskar | 89,074 | 4.1% | +0.94pp |
| 8 | Honda Cars | 58,220 | 2.7% | −0.40pp |
| 9 | Renault India | 35,009 | 1.6% | −0.32pp |
| 10 | Nissan India | 20,552 | 0.9% | −0.24pp |
Our Vahan data holds maker by fuel for the year, not the month, so this table is full-year 2025.
Each carmaker's fuel mix
How the twelve largest carmakers split their full-year 2025 volume by fuel.
| # | Manufacturer | Cars | Petrol | Diesel | CNG | Hybrid | EV |
|---|---|---|---|---|---|---|---|
| 1 | Maruti Suzuki | 16,04,679 | 56.5% | 0.0% | 30.4% | 13.1% | 0.0% |
| 2 | Mahindra | 5,54,005 | 20.2% | 79.2% | 0.0% | 0.0% | 0.6% |
| 3 | Hyundai | 5,47,366 | 66.7% | 20.9% | 11.0% | 0.0% | 1.3% |
| 4 | Tata Motors (PV) | 5,10,501 | 53.8% | 13.5% | 32.6% | 0.0% | 0.0% |
| 5 | Toyota Kirloskar | 3,04,545 | 29.2% | 20.1% | 7.8% | 42.8% | 0.0% |
| 6 | Kia India | 2,67,493 | 65.7% | 32.5% | 0.7% | 0.0% | 1.1% |
| 7 | Skoda | 1,14,665 | 99.7% | 0.0% | 0.0% | 0.3% | 0.0% |
| 8 | Tata Motors (EV) | 71,695 | 0.0% | 0.0% | 0.0% | 0.0% | 100.0% |
| 9 | MG Motor | 71,090 | 17.2% | 3.9% | 0.0% | 0.0% | 78.9% |
| 10 | Honda Cars | 63,126 | 92.2% | 0.0% | 6.2% | 1.6% | 0.0% |
| 11 | Renault India | 37,492 | 93.4% | 0.0% | 6.6% | 0.0% | 0.0% |
| 12 | Mahindra Electric Automobile | 30,420 | 0.0% | 0.0% | 0.0% | 0.0% | 100.0% |
Frequently asked questions
What share of cars sold in India in December 2025 were CNG?
Which company sells the most CNG cars in India?
Which company sells the most diesel cars in India?
Which company sells the most hybrid cars in India?
Which company sells the most electric cars in India?
Are hybrids counted as electric cars here?
Car Sales by Fuel, earlier months
More from the reports desk
Source. Every figure is a vehicle registration, taken from the Ministry of Road Transport & Highways' Vahan 4 dashboard (vahan.parivahan.gov.in) — the same source FADA and the industry use for retail data. Registrations are not the wholesale dispatch numbers manufacturers announce each month. "EV" means battery electric (Vahan fuels PURE EV and ELECTRIC(BOV)); hybrids are counted separately. Information only, not investment advice.
Using these numbers? Cite "Flash Finance (Vahan data)" with a link to this page. This report's chart card is free to republish with the same credit.