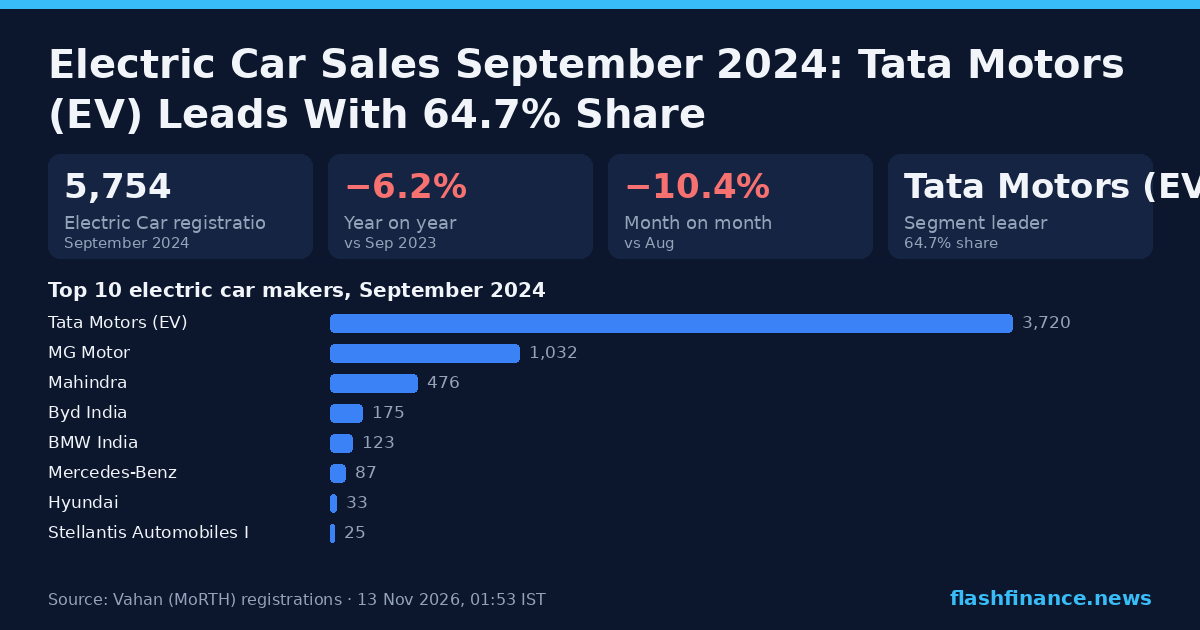
Electric Car Sales September 2024: Tata Motors (EV) Leads With 64.7% Share
Every electric car registered in India in September 2024, brand by brand: volumes, market share inside the segment, month-on-month and year-on-year change, and who gained or lost share.
How September went
India registered 5,754 electric cars in September 2024, −6.2% on September 2023 and −10.4% on August.
Across the 9 completed months of 2024 to September, 65,633 electric cars have been registered, +13.9% on the same months of 2023.
Electric cars were 2.1% of every car registered in September 2024, against 1.9% in September 2023 (+0.3pp).
Monthly electric car registrations, 2023–2026
One line per calendar year. The dashed end of the current year is the month so far.
Electric Car market share, September 2024
Tata Motors (EV) led the month with 3,720 registrations — 64.7% of the electric car market — ahead of MG Motor on 1,032 (17.9%), a gap of 2,688 units. Tata Motors (EV) also led August.
Tata Motors (EV) has gained the most share against September 2023, +3.58pp to 64.7%; Hyundai has lost the most, −2.93pp to 0.6%.
The top three hold 90.9% of the segment; 17 manufacturers registered at least one electric car.
Top 10 electric car makers, September 2024
Electric car registrations only — every other vehicle type these companies make is excluded.
Share is of every electric car registered in the month. MoM and YoY compare each maker's own volume; the last column is its change in share of the segment.
| # | Manufacturer | Sep 2024 | Share | MoM | YoY | Share vs Sep 2023 |
|---|---|---|---|---|---|---|
| 1 | Tata Motors (EV) | 3,720 | 64.7% | −10.9% | −0.7% | +3.58pp |
| 2 | MG Motor | 1,032 | 17.9% | −26.0% | +2.3% | +1.49pp |
| 3 | Mahindra | 476 | 8.3% | +48.3% | +25.6% | +2.10pp |
| 4 | Byd India | 175 | 3.0% | −15.5% | +23.2% | +0.73pp |
| 5 | BMW India | 123 | 2.1% | +70.8% | +43.0% | +0.74pp |
| 6 | Mercedes-Benz | 87 | 1.5% | +50.0% | +16.0% | +0.29pp |
| 7 | Hyundai | 33 | 0.6% | −28.3% | −84.7% | −2.93pp |
| 8 | Stellantis Automobiles India | 25 | 0.4% | −47.9% | −80.5% | −1.65pp |
| 9 | Kia India | 21 | 0.4% | +0.0% | −46.2% | −0.27pp |
| 10 | Volvo | 16 | 0.3% | −52.9% | −72.9% | −0.68pp |
| 11 | Audi Ag | 14 | 0.2% | +40.0% | −46.2% | −0.18pp |
| 12 | Tata Motors (PV) | 14 | 0.2% | −22.2% | −93.1% | −3.05pp |
| 13 | Byd Auto | 12 | 0.2% | +71.4% | −36.8% | −0.10pp |
| 14 | Porsche Ag Germany | 3 | 0.1% | −40.0% | −40.0% | −0.03pp |
| 15 | Rolls Royce Motor (Importer: Kun Motor) | 1 | 0.0% | — | — | +0.02pp |
| All others (2 makers) | 2 | 0.0% |
Exact: Vahan's maker x month table filtered to battery-electric fuels (PURE EV, ELECTRIC(BOV)) and the segment's vehicle classes — not a company total multiplied by anything.
Who is gaining
Monthly share of the electric car market for the six largest makers this month, over the last 15 completed months.
Electric Car market share by month
Share of the segment each month, in per cent.
Market share, 2024 to September
The same table over 2024 to September, set against the same months of 2023.
| # | Manufacturer | Units | Share | vs 2023 | Volume YoY |
|---|---|---|---|---|---|
| 1 | Tata Motors (EV) | 42,315 | 64.47% | +27.91pp | +100.9% |
| 2 | MG Motor | 12,232 | 18.64% | +5.50pp | +61.6% |
| 3 | Mahindra | 5,261 | 8.02% | +2.68pp | +71.1% |
| 4 | Byd India | 1,643 | 2.50% | +0.09pp | +17.9% |
| 5 | Hyundai | 873 | 1.33% | −0.79pp | −28.7% |
| 6 | BMW India | 830 | 1.26% | −0.19pp | −0.7% |
| 7 | Mercedes-Benz | 610 | 0.93% | +0.24pp | +52.9% |
| 8 | Tata Motors (PV) | 522 | 0.80% | −32.62pp | −97.3% |
| 9 | Volvo | 388 | 0.59% | −0.13pp | −6.1% |
| 10 | Stellantis Automobiles India | 370 | 0.56% | −1.89pp | −73.8% |
| 11 | Kia India | 219 | 0.33% | −0.34pp | −43.6% |
| 12 | Audi Ag | 130 | 0.20% | +0.01pp | +18.2% |
| 13 | Others | 86 | 0.13% | +0.07pp | +126.3% |
| 14 | Porsche Ag Germany | 62 | 0.09% | +0.01pp | +26.5% |
| 15 | Byd Auto | 56 | 0.09% | −0.45pp | −82.0% |
How electric are cars?
The battery-electric share of all cars registered each month — the adoption curve behind the brand race above.
EV share of cars by month
Battery-electric registrations as a per cent of the whole segment. The dashed end of the current year is the month so far.
How electric is each car maker?
Every car maker's September 2024 volume, split into battery-electric and everything else (petrol, diesel, CNG and hybrid). Leave the EVs out and Maruti Suzuki leads the non-electric cars market with 39.1%.
Among the established makers, MG Motor has gone furthest: 32.0% of its cars were electric.
| # | Manufacturer | All cars | Electric | Non-EV | EV share of its sales | Share of non-EV market |
|---|---|---|---|---|---|---|
| 1 | Maruti Suzuki | 1,02,763 | 0 | 1,02,763 | 0.0% | 39.1% |
| 2 | Hyundai | 38,809 | 33 | 38,776 | 0.1% | 14.8% |
| 3 | Mahindra | 35,123 | 476 | 34,647 | 1.4% | 13.2% |
| 4 | Tata Motors (PV) | 33,446 | 3,734 | 29,712 | 11.2% | 11.3% |
| 5 | Toyota Kirloskar | 19,304 | 0 | 19,304 | 0.0% | 7.3% |
| 6 | Kia India | 16,484 | 21 | 16,463 | 0.1% | 6.3% |
| 7 | Skoda | 5,777 | 1 | 5,776 | 0.0% | 2.2% |
| 8 | Honda Cars | 4,055 | 0 | 4,055 | 0.0% | 1.5% |
| 9 | MG Motor | 3,220 | 1,032 | 2,188 | 32.0% | 0.8% |
| 10 | Renault India | 2,855 | 0 | 2,855 | 0.0% | 1.1% |
| 11 | Nissan India | 2,163 | 0 | 2,163 | 0.0% | 0.8% |
| 12 | Mercedes-Benz | 1,451 | 87 | 1,364 | 6.0% | 0.5% |
| 13 | BMW India | 1,139 | 123 | 1,016 | 10.8% | 0.4% |
| 14 | Jaguar Land Rover India | 485 | 0 | 485 | 0.0% | 0.2% |
| 15 | Stellantis India | 399 | 0 | 399 | 0.0% | 0.2% |
All cars: Vahan maker x month for the segment's vehicle classes, every fuel. Electric: the same table, battery-electric fuels only. Non-EV is the difference — petrol, diesel, CNG and hybrid. EV arms filed as separate makers are counted with their parent: Tata Motors (EV) with Tata Motors (PV).
Where they sell
Maharashtra registered the most electric cars in September 2024 — 905, 15.7% of the national total. Kerala (863) and Karnataka (700) followed.
| # | State | Units | Share | YoY |
|---|---|---|---|---|
| 1 | Maharashtra | 905 | 15.7% | +10.2% |
| 2 | Kerala | 863 | 15.0% | +0.2% |
| 3 | Karnataka | 700 | 12.2% | −2.1% |
| 4 | Tamil Nadu | 536 | 9.3% | +21.8% |
| 5 | Rajasthan | 380 | 6.6% | +4.1% |
| 6 | Uttar Pradesh | 355 | 6.2% | −31.2% |
| 7 | Gujarat | 333 | 5.8% | −47.4% |
| 8 | Telangana | 286 | 5.0% | −21.6% |
| 9 | Haryana | 200 | 3.5% | +177.8% |
| 10 | West Bengal | 166 | 2.9% | +6.4% |
| 11 | Madhya Pradesh | 151 | 2.6% | +3.4% |
| 12 | Odisha | 139 | 2.4% | +40.4% |
Frequently asked questions
How many electric cars were sold in India in September 2024?
Which company sold the most electric cars in September 2024?
What is the electric car market share of each brand?
What share of cars sold in India are electric?
Which state buys the most electric cars?
How are these numbers measured?
Electric Car sales, earlier months
More from the reports desk
Source. Every figure is a vehicle registration, taken from the Ministry of Road Transport & Highways' Vahan 4 dashboard (vahan.parivahan.gov.in) — the same source FADA and the industry use for retail data. Registrations are not the wholesale dispatch numbers manufacturers announce each month. "EV" means battery electric (Vahan fuels PURE EV and ELECTRIC(BOV)); hybrids are counted separately. Information only, not investment advice.
Using these numbers? Cite "Flash Finance (Vahan data)" with a link to this page. This report's chart card is free to republish with the same credit.