EV Sales Q2 FY 2025-26: 5,84,151 Units, Up 12.7% YoY
Every EV registered in India over Q2 FY 2025-26 — July 2025 to September 2025. Q2 of the financial year, July to September. Month-by-month volumes, the manufacturer leaderboard, which segments those EVs are in, and the same window in every earlier year on record.
EV sales month by month, Q2 FY 2025-26
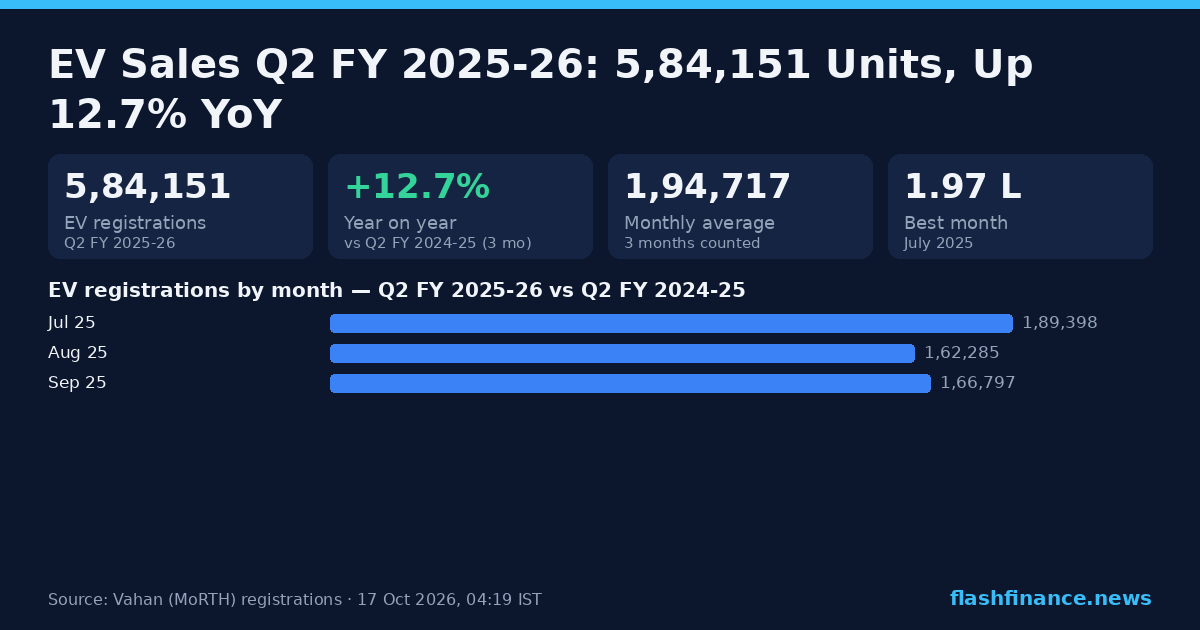
India's electric-vehicle market registered 5,84,151 EVs in Q2 FY 2025-26. Volumes grew strongly 12.7% against the 5,18,480 logged over the same 3 months of Q2 FY 2024-25.
July was the strongest month of the period at 1,97,337 EVs and September the quietest at 1,91,541, an average of 1,94,717 a month. Every one of those 3 months grew on the same month a year earlier.
July sits inside the monsoon, historically a soft month for urban showroom footfall and a strong one for farm equipment.
Q2 FY 2025-26 ran from July 2025 to September 2025 and is closed. Every month in the table below is final, and every comparison on this page is against the matching month of Q2 FY 2024-25.
EVs accounted for 9.6% of everything registered in India over the period, up from 8.7% in Q2 FY 2024-25. The whole market ran to 60,62,099 vehicles over the same window, up 1.8% year on year.
EV registrations by month — Q2 FY 2025-26 vs Q2 FY 2024-25
Vahan retail registrations, each month set against the same month a year earlier.
Every completed month of Q2 FY 2025-26, with the matching month of Q2 FY 2024-25 beside it.
| Month | Q2 FY 2025-26 units | Q2 FY 2024-25 units | YoY | Share of period |
|---|---|---|---|---|
| July 2025 | 1,97,337 | 1,89,398 | +4.2% | 33.8% |
| August 2025 | 1,95,273 | 1,62,285 | +20.3% | 33.4% |
| September 2025 | 1,91,541 | 1,66,797 | +14.8% | 32.8% |
Each month links through to its own full report.
Who is selling the EVs
Our Vahan data holds manufacturer volumes split by fuel only across a whole calendar year, so the EV leaderboard below covers full-year 2025 rather than Q2 FY 2025-26 alone. It is exact for that window.
Bajaj Auto holds 15.3% of battery-electric registrations over full-year 2025, ahead of TVS Motor.
Top EV manufacturers — full-year 2025
Battery-electric registrations only; hybrids are counted separately.
| # | Manufacturer | EV units | Share | vs full-year 2024 |
|---|---|---|---|---|
| 1 | Bajaj Auto | 3,59,773 | 15.26% | +3.18pp |
| 2 | TVS Motor | 3,36,906 | 14.29% | +2.57pp |
| 3 | Ather Energy | 2,16,466 | 9.18% | +2.45pp |
| 4 | Ola Electric | 2,04,548 | 8.68% | −12.50pp |
| 5 | Hero MotoCorp | 1,13,030 | 4.80% | +2.54pp |
| 6 | Mahindra Last Mile | 98,157 | 4.16% | +0.83pp |
| 7 | Tata Motors (EV) | 76,688 | 3.25% | +0.09pp |
| 8 | Greaves Electric | 57,699 | 2.45% | +0.67pp |
| 9 | MG Motor | 57,262 | 2.43% | +1.28pp |
| 10 | YC Electric | 41,207 | 1.75% | −0.42pp |
| 11 | Mahindra Electric Automobile | 30,422 | 1.29% | +1.29pp |
| 12 | BGauss | 25,131 | 1.07% | +0.11pp |
| 13 | Saera Electric | 24,792 | 1.05% | −0.35pp |
| 14 | Dilli Electric | 21,920 | 0.93% | −0.31pp |
| 15 | PURE EV (PuR) | 17,998 | 0.76% | +0.47pp |
Which segments the EVs are in
The chart is period-exact: it is the battery-electric share of every vehicle registered in each month of Q2 FY 2025-26. The split by segment underneath comes from a calendar-year table — Vahan publishes class against fuel only across a whole year — so it covers full-year 2025.
EV share of the Indian market, month by month
EVs as a percentage of every vehicle registered that month.
Battery-electric volumes only; hybrids are counted separately.
| Segment | 2025 EV units | Share | vs full-year 2024 |
|---|---|---|---|
| Two-Wheelers | 13,42,287 | 56.95% | −3.00pp |
| Three-Wheelers | 8,00,627 | 33.97% | −0.33pp |
| Cars & UVs | 1,87,761 | 7.97% | +3.27pp |
| Goods Carriers | 11,531 | 0.49% | +0.17pp |
| Taxis & Cabs | 8,091 | 0.34% | −0.15pp |
| Buses | 4,929 | 0.21% | +0.01pp |
| Other | 1,526 | 0.06% | +0.02pp |
| Tractors | 219 | 0.01% | +0.01pp |
Fuel mix, Q2 FY 2025-26
Battery-electric vehicles were 9.6% of every registration in Q2 FY 2025-26, against 8.7% in Q2 FY 2024-25. That is 5,84,151 electric vehicles across all segments.
Fuel labels come straight from Vahan and the split below covers the whole market over July 2025 to September 2025 — petrol includes the E20 ethanol blend, which is now the single largest label in the database.
Registrations by fuel — Q2 FY 2025-26
Every vehicle registered in the period, by fuel.
Exact fuel volumes over July 2025 to September 2025.
| Fuel | Q2 FY 2025-26 units | Share | vs Q2 FY 2024-25 | Share move |
|---|---|---|---|---|
| Petrol | 43,47,930 | 71.72% | −0.7% | −1.76pp |
| Diesel | 6,72,817 | 11.10% | +5.5% | +0.39pp |
| Electric | 5,84,151 | 9.64% | +12.7% | +0.93pp |
| CNG / LPG | 3,61,284 | 5.96% | +12.1% | +0.55pp |
| Hybrid | 79,049 | 1.30% | −7.8% | −0.14pp |
| Other | 16,868 | 0.28% | +12.1% | +0.03pp |
Every Q2 on record
Across the 3 completed windows in our Vahan record, EV registrations went from 5,18,480 in Q2 FY 2024-25 to 9,72,812 in Q2 FY 2026-27, up 87.6% over the stretch.
EV registrations by quarter
* window still in progress.
| Period | Months | Units | YoY |
|---|---|---|---|
| Q2 FY 2026-27 | 3 | 9,72,812 | +66.5% |
| Q2 FY 2025-26 | 3 | 5,84,151 | +12.7% |
| Q2 FY 2024-25 | 3 | 5,18,480 | +35.2% |
Each row compares only the months that window holds, so a part period is never set against a full one.
Frequently asked questions
How many EVs were sold in India in Q2 FY 2025-26?
What period does Q2 FY 2025-26 cover?
Which was the strongest month for EV sales in Q2 FY 2025-26?
Which quarter had the highest EV sales?
Are these retail sales or factory dispatches?
EV sales, other periods
More from the reports desk
Source. Every figure is a vehicle registration, taken daily from the Ministry of Road Transport & Highways' Vahan 4 dashboard (vahan.parivahan.gov.in) — the same source FADA and the industry use for retail data. Registrations are not the wholesale dispatch numbers manufacturers announce each month. "EV" means battery electric (Vahan fuels PURE EV and ELECTRIC(BOV)); hybrids are counted separately. Information only, not investment advice.
Using these numbers? Cite "Flash Finance (Vahan data)" with a link to this page. This report's chart card is free to republish with the same credit. A free, auto-updating EV registrations widget can go on any website.