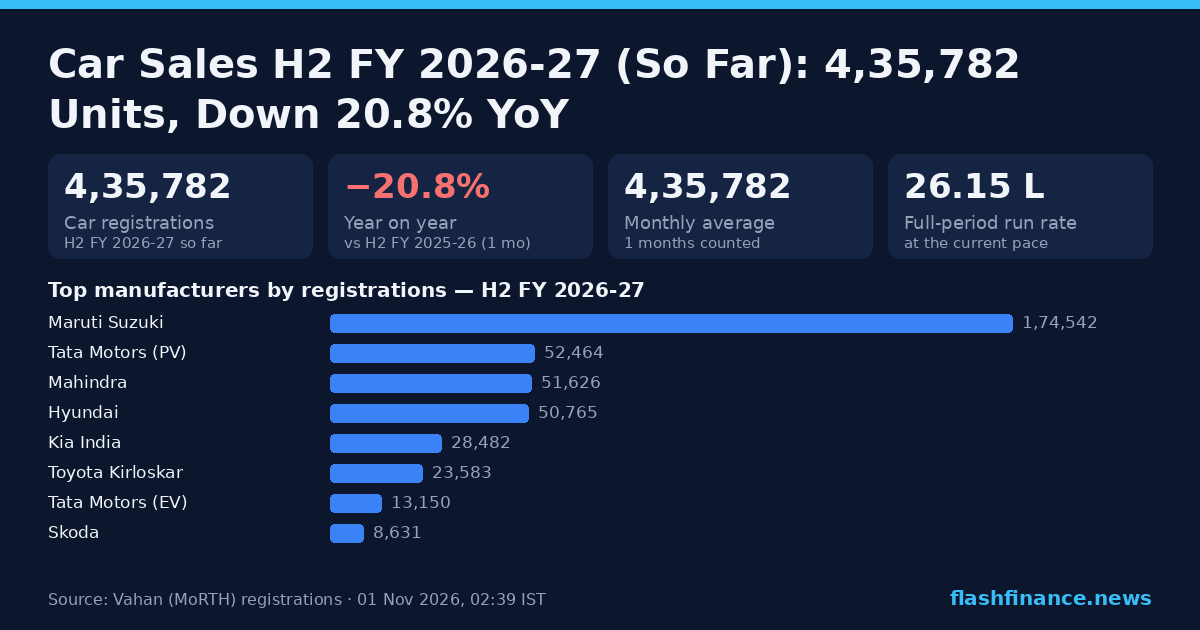
Car Sales H2 FY 2026-27 (So Far): 4,35,782 Units, Down 20.8% YoY
Every car registered in India over H2 FY 2026-27 so far — October 2026. The second half of the financial year, October to March. Month-by-month volumes, the manufacturer leaderboard, how the segment moved against the rest of the market, and the same window in every earlier year on record.
Live. H2 FY 2026-27 is still in progress — this page grows as new registrations are published.
Car sales month by month, H2 FY 2026-27
India's passenger car market registered 4,35,782 cars in H2 FY 2026-27 so far. Volumes fell 20.8% against the 5,50,165 logged over the same month of H2 FY 2025-26.
October is the festive peak. Navratri and Diwali make it the single biggest registration month of most years, so year-on-year comparisons swing on where the festivals fall.
H2 FY 2026-27 still has 5 months to run. Held at the pace of the 1 months already counted, it would finish near 26.15 L cars — a run rate rather than a forecast, and the festive quarter moves it more than anything else on this page.
Cars accounted for 14.4% of everything registered in India over the period, up from 13.2% in H2 FY 2025-26. The whole market ran to 30,33,135 vehicles over the same window, down 27.3% year on year.
These are privately registered cars and UVs. Vahan books taxis and cabs as a class of their own, another 34,549 in H2 FY 2026-27 so far, and passenger-vehicle figures published elsewhere usually include them. With taxis, the period stands at 4,70,331 passenger vehicles.
Car registrations by month — H2 FY 2026-27 vs H2 FY 2025-26
Vahan retail registrations, each month set against the same month a year earlier.
Every completed month of H2 FY 2026-27, with the matching month of H2 FY 2025-26 beside it.
| Month | H2 FY 2026-27 units | H2 FY 2025-26 units | YoY | Share of period |
|---|---|---|---|---|
| October 2026 | 4,35,782 | 5,50,165 | −20.8% | 100.0% |
Each month links through to its own full report.
Which manufacturer sold the most, H2 FY 2026-27
Maruti Suzuki led the period with 1,74,542 registrations, down 21.0% on H2 FY 2025-26. Tata Motors (PV) follows on 52,464, 1,22,078 behind — a gap of 3.33x.
The fastest riser in the top 8 was Tata Motors (EV), up 65.5% to 13,150, while Skoda was down 35.5% at 8,631.
Volumes here are registrations inside the segment only, counted with Vahan's own vehicle-class filter, so each is the manufacturer's car volume over H2 FY 2026-27. Companies that file electric models under a maker of their own appear as separate rows.
Top manufacturers by registrations — H2 FY 2026-27
Registrations inside the segment (cars only).
Exact registrations over October 2026, with the change against H2 FY 2025-26.
| # | Manufacturer | H2 FY 2026-27 units | Share of cars | vs H2 FY 2025-26 |
|---|---|---|---|---|
| 1 | Maruti Suzuki | 1,74,542 | 40.05% | −21.0% |
| 2 | Tata Motors (PV) | 52,464 | 12.04% | −25.9% |
| 3 | Mahindra | 51,626 | 11.85% | −22.9% |
| 4 | Hyundai | 50,765 | 11.65% | −22.8% |
| 5 | Kia India | 28,482 | 6.54% | −18.4% |
| 6 | Toyota Kirloskar | 23,583 | 5.41% | −34.1% |
| 7 | Tata Motors (EV) | 13,150 | 3.02% | +65.5% |
| 8 | Skoda | 8,631 | 1.98% | −35.5% |
| 9 | Mahindra Electric Automobile | 7,663 | 1.76% | +89.4% |
| 10 | MG Motor | 6,555 | 1.50% | −1.8% |
| 11 | Honda Cars | 4,972 | 1.14% | −34.2% |
| 12 | Renault India | 3,276 | 0.75% | −37.2% |
| 13 | Nissan India | 3,111 | 0.71% | +17.9% |
| 14 | BMW India | 1,679 | 0.39% | +1.2% |
| 15 | Mercedes-Benz | 1,576 | 0.36% | −23.2% |
Car sales against the rest of the market
Set against the rest of the market, cars outgrew the national picture over H2 FY 2026-27: −20.8% against −27.3% for every vehicle registered in India.
The table covers every segment Vahan reports over the same 1-month window, so the comparison is like for like — the same months, the same source, on both sides.
Car share of the Indian market, month by month
Cars as a percentage of every vehicle registered that month.
Exact segment volumes over October 2026.
| Segment | H2 FY 2026-27 units | Share | vs H2 FY 2025-26 |
|---|---|---|---|
| Two-Wheelers | 22,31,325 | 73.56% | −31.1% |
| Cars & UVs | 4,35,782 | 14.37% | −20.8% |
| Three-Wheelers | 1,31,836 | 4.35% | −2.9% |
| Goods Carriers | 98,225 | 3.24% | −4.8% |
| Tractors | 73,694 | 2.43% | −1.8% |
| Taxis & Cabs | 34,549 | 1.14% | −12.7% |
| Other classes | 18,287 | 0.60% | +1.0% |
| Buses | 9,437 | 0.31% | +6.3% |
What cars run on
Vahan splits a segment by fuel only across a whole calendar year, so this table covers 2026 year to date rather than H2 FY 2026-27 alone — it is exact for that window.
Petrol accounts for 46.2% of car registrations over 2026 year to date, with battery-electric at 6.8%.
Car registrations by fuel — 2026 year to date
The 2026 year to date mix.
| Fuel | 2026 units | Share | vs full-year 2025 |
|---|---|---|---|
| Petrol | 18,83,243 | 46.19% | −5.16pp |
| CNG / LPG | 8,00,405 | 19.63% | +2.15pp |
| Diesel | 7,41,435 | 18.19% | −0.22pp |
| Hybrid | 3,73,006 | 9.15% | +0.80pp |
| Electric | 2,77,976 | 6.82% | +2.42pp |
| Other | 872 | 0.02% | +0.01pp |
Every H2 on record
Across the 2 completed windows in our Vahan record, car registrations went from 21,88,075 in H2 FY 2024-25 to 26,34,012 in H2 FY 2025-26, up 20.4% over the stretch.
H2 FY 2026-27 is still running — 1 of its 6 months are counted — so it is a part window and is never set against a full one. Its year-on-year figure compares only the months it actually holds.
Car registrations by half year
* window still in progress.
| Period | Months | Units | YoY |
|---|---|---|---|
| H2 FY 2026-27 (to date) | 1 | 4,35,782 | −20.8% |
| H2 FY 2025-26 | 6 | 26,34,012 | +20.4% |
| H2 FY 2024-25 | 6 | 21,88,075 | +7.8% |
Each row compares only the months that window holds, so a part period is never set against a full one.
Frequently asked questions
How many cars were sold in India in H2 FY 2026-27?
What period does H2 FY 2026-27 cover?
Which manufacturer sold the most cars in H2 FY 2026-27?
What share of the Indian market were cars in H2 FY 2026-27?
What will full-year H2 FY 2026-27 car sales be?
Which half year had the highest car sales?
Are these retail sales or factory dispatches?
Car sales, other periods
More from the reports desk
Source. Every figure is a vehicle registration, taken from the Ministry of Road Transport & Highways' Vahan 4 dashboard (vahan.parivahan.gov.in) — the same source FADA and the industry use for retail data. Registrations are not the wholesale dispatch numbers manufacturers announce each month. "EV" means battery electric (Vahan fuels PURE EV and ELECTRIC(BOV)); hybrids are counted separately. Information only, not investment advice.
Using these numbers? Cite "Flash Finance (Vahan data)" with a link to this page. This report's chart card is free to republish with the same credit.